网站渲染LaTeX存在严重失真,如有需要请Email联系我获取PDF版本笔记。
什么是统计学?
人生,是从不充分的证据开始,引出完美结论的一种艺术。——Samuel Bulter
如果我们不在同一时期,把理解了的科学知识变为我们日常生活的一部分,科学家降不可能提高他们互相拥有的知识。——J.D.Bernal
与人类有关的事实,可以由数量来表示,并且经过大量的积累重复可以导出一般规律。——英国皇家统计学会
Chapter 1 事件与概率 Random Events and Probability
1.1 随机试验和随机事件
-
**随机现象:**自然界中的客观现象,当人们观测它时,所得结果不能预先确定,而仅仅是多种可能结果之一。
-
**随机试验 random experiment:**随机现象的实现和对它某个特征的观测。
-
**基本事件 elemental event:**随机试验中的每个单一结果,犹如分子中的原子,在化学反应中不可再分。
e.g. 硬币抛3次,有8种结果:正正正、正正反、正反正……这8种可能结果的每一个都是基本事件。
-
**随机事件 random event:**简称事件 event,在随机试验中我们所关心的可能出现的各种结果,它由一个或若干个基本事件组成。通常用英文大写字母表示或{一种叙述}来表示。
-
**样本空间 sample space:**随机试验中所有基本事件所构成的集合,通常用$\Omega$或$S$表示。Elemental event is the element of sample space, so it is also called sample point
e.g. 掷一枚骰子,观察出现的点数,则$\Omega={1,2,3,4,5,6}$.
-
**必然事件 certain event($\Omega$):**在试验中一定会发生的事件。
-
**不可能事件 impossible event($\emptyset$):**在试验中不可能发生的事件。
1.2 事件的运算
-
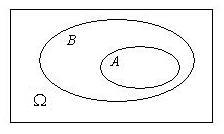
**子事件$A\subset B$:**事件$A$发生蕴含时间$B$一定发生,则时间$A$成为事件$B$的子事件。若$A\subset B$,且$B\subset A$,则称时间$A$与事件$B$相等,记为$A=B$.
-
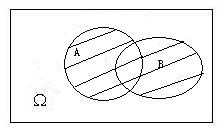
**事件的和 the sum / union of events($$A\cup B$$):**事件$A$和事件$B$中至少有一个发生称为事件$A$和事件$B$的和。
-
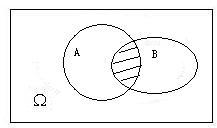
**事件的积 the product / intersection of events($A\cap B$):**事件$A$和事件$B$同时发生称为$A$和事件$B$的积。如果$A\cap B=\phi$,则称$A$和$B$不相容,即事件$A$和$B$不能同时发生。
-
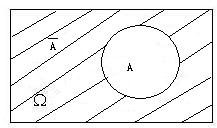
对立事件 the complementary / inverse event $A^c$(或$\overline{A}$):$A$不发生这一事件称为事件$A$的对立事件(或余事件)。
-
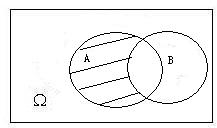
**事件$A$和事件$B$的差 the difference of events($A-B$):**事件$A$发生而事件$B$不发生这一事件称为事件$A$和事件$B$的差,或等价于$AB^c$.
-
De Morgan 对偶法则 De Morgan dualization law
$$
\overline{A\cup B}=\overline{A}\cap \overline{B},
$$
$$
\overline{A\cap B}=\overline{A}\cup \overline{B}
$$
上式可推广到n个事件:
$$
\overline{\bigcup_{i=1}^{n}A_i}=\bigcap_{i=1}^{n}\overline{A_i},
$$
$$
\overline{\bigcap_{i=1}^{n}A_i}=\bigcup_{i=1}^{n}\overline{A_i},
$$
1.3 概率的定义 Event Probability
概率是随机事件发生可能性大小的数字表征,其值在0和1之间,即概率是事件的函数。概率有以下定义:
1.3.1 古典概率 Classical Probability Model
设一个试验有N个等可能的结果,而事件$E$恰包含其中的$M$个结果,则事件$E$的概率,记为$P(E)$,定义为
$$
P(E)=M/N
$$
或
$$
P(E)=#(M) / #(N),
$$
其中,$#(M)$为事件$M$中基本事件的个数。
古典概型有两个条件:
- 有限性,试验结果只有有限个(记为n),
- 等可能性,每个基本时间发生的可能性相同。
**注:**古典概率可引申出“几何概率”。
1.3.2 概率的统计定义 Statistical Probability
古典概率的两个条件往往不能满足,但可以将事件的随机试验独立反复做n次(Bernouli试验),设事件$A$发生了$n_A$次,称比值$\frac{n_A}{n}$为事件$A$发生的频率,当n越来越大时,频率会在某个值p附近波动,且波动越来越小,这个值p就定义为事件$A$的概率。该学派为频率派。
**注:**不能写为$lim_{n\rightarrow{\infty}}\frac{n_A}{n}=p$,因为$\frac{n_A}{n}$不是n的函数。
1.3.3 主观概率 Subjective Probability
主观概率可以理解为一种心态或倾向性。究其根由,大抵有二:一是根据其经验和知识,二是根据其利害关系。该学派在金融和管理有大量的应用,这一学派成为Bayes学派。
1.3.4 概率的公理化定义 Axiomatic Definition of Probability
对概率运算规定一些简单的基本法则:
-
非负性 non-negativity:设$A$是随机事件,则$0 \leq P(A) \leq 1$,
-
规范性 normalization:设$\Omega$为必然事件,则$P(\Omega)=1$, 设$\emptyset$为不可能事件,则$P(\emptyset)=0$,
-
可列可加性 countable additivity:若事件$A$和$B$不相容,则$P(A\cup B)=P(A)+P(B)$,
可推广至无穷:$$P(\bigcup_{i=1}^{n}A_i)=\sum_{i=1}^{\infty}P(A_i)$$. (加法定理 Addition Law of Exclusive Events)
注:
- $P(A\cup B)=P(A)+P(B)-P(AB)$ > $P(A\cup B \cup C)=P(A)+P(B)+P©-P(AB)-P(AC)-P(BC)+P(ABC)$
(一般加法定理 General Addition Law)- $P(\overline{A})=1-P(A)$ (对立事件公式 Difference Formula of Events)
- $P(A-B)=P(A)-P(AB)$ (事件之差公式 Complementary Event Formula)
1.4 古典概率计算
1.4.1 排列组合
- **选排列:**从n个不同元素中取r个不同取法($1\leq r\leq n$),$P^{n}_{r}=n(n-1)…(n-r+1)$.
- **重复排列:**从n个不同元素中可重复地取r个不同取法($1\leq r\leq n$),$P^{n}_{r}=n^r$.
- **组合:**同选排列,但不考虑次序,$\binom{n}{r}=\frac{P^{n}_{r}}{r!}$.
注:
- 排列英文为 Permutation,组合英文为 Combination.
- $0!$为1。当r不是非负整数时,记号$r!$没有意义.
- 一些书中将组合写成$C_{n}^{r}$或$C_{r}^{n}$,更通用的是$\binom{n}{r}$.
1.4.2 其他公式
- 组合系数$\binom{n}{r}$又常称为二项式系数
$$
(a+b)^n=\sum_{i=0}^{n}\binom{n}{r}a^i b^{n-1}
$$
- n个相异物件分成k堆,各堆物件数分为$r_1, …, r_k$的方法是
$$
n!/(r_1!..r_k!).
$$
1.5 条件概率 Conditional Probability
条件概率就是知道了一定信息下得到的随机事件的概率。设事件$A$和$B$是随机试验$\Omega$中的两个事件,$P(B)>0$,称
$$
P(A|B)=\frac{P(AB)}{P(B)}
$$
为事件$B$发生条件下事件$A$发生的条件概率,可用图形表示:

**注:**事实上,我们所考虑的概率都是在一定条件下计算的,因为随机试验就是在一定条件下进行的。
1.5.1 条件概率性质
给定$A$发生,$P(A)>0$:
- $0 \leq P(B|A) \leq 1$
- $0 \leq P(\Omega|A) = 1$
- 若$B_1 \cap B_2 = \phi _1$,则$P(B_1 \cup B_2 | A) = P(B_1|A) + P(B_2|A)$,可推广至无穷。
1.5.2 乘法定理 Multiplication Theorem of Probability
由$P(A|B)=\frac{P(AB)}{P(B)} \Rightarrow P(AB)=P(A|B)P(B)$,可推广至
$$
P(A_1 A_2 …A_n)=P(A_1)P(A_2|A_1)…P(A_n|A_1…A_{n-1})
$$
注: 右边看似麻烦,其实容易算,左边看似简单,但是难算。
1.6 全概率 Total Probability
设$B_1,B_2,…B_n$是样本空间$\Omega$中的两两不相容的一组事件,即$B_i B_j=\phi$,$i\neq j$,且满足$\bigcup_{i=1}^{n}B_i=\Omega$,则称$B_1,B_2,…B_n$是样本空间$\Omega$的一个分割 partition(又称为完备事件群 Collectively exhaustive events)。
$P(B_i)$ is also known as prior probability. Prior probability, in Bayesian statistics, is the probability of an event before new data is collected. $A$ is composed of the sum of all the exclusive events, and $P(A)$ is called total probability.
设${B_1,B_2,…B_n}$是样本空间$\Omega$的一个分割,$A$为$\Omega$的一个事件,则(全概率公式 Law of Total Probability)
$$
P(A)=\sum_{i=1}^{n}P(A|B_i)P(B_i)
$$
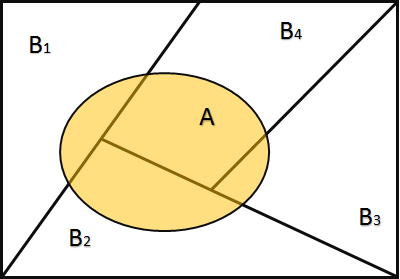
Proof:
Since $B_1,B_2,…B_n$ are mutually exclusive, $AB_1,AB_2,…AB_n$ are also mutually exclusive. Therefore, by addition theorem and multiplication theorem we can get
$$
\begin{align}
P(A)&=P(A \cap \Omega)\
&=P(A \cap \sum_{i=1}^{n}B_i)\
&=P(\sum_{i=1}^{n}AB_i)\
&=\sum_{i=1}^{n}P(AB_i)\
&=\sum_{i=1}^{n}P(A|B_i)P(B_i)\
&=\sum_{i=1}^{n}P(A|B_i)P(B_i)
\end{align}
$$
**注:**有时不易直接计算事件$A$的概率,但是在每个$B_i$上$A$的条件概率容易求出
1.7 Bayes公式 Bayes’ Theorem(逆概率公式)
设${B_1, B_2, …B_n}$是样本空间的一个分割,$A$为$\Omega$中的一个事件,$P(B_i)>0$,$i=1,2,…,n$,$P(A)>0$,则
$$
P(B_i|A)=\frac{P(A|B_i)P(B_i)}{\sum_{j=1}^{n}P(A|B_j)P(B_j)}
$$
Proof: From conditional probability formula, substitute law of total probability and multiplication theorem.
**注:**当有因果关系互换时必须用Bayes公式。
1.8 事件的独立性 Independence of Events
设$A$,$B$是随机试验中的两个事件,若满足$P(AB)=P(A)P(B)$,则称事件$A$和$B$相互独立。判断事件的独立,应该是从实际出发,如果能够判断事件$B$的发生与否对事件$A$的发生与否不产生影响,则事件$A$,$B$即为独立。
If events $A$ and $B$ are mutually independent, then $A$ and $\overline{B}$, $\overline{A}$ and $B$, $\overline{A}$ and $\overline{B}$ are all mutually independent.
设$\widetilde{A}$表示事件$A$发生和不发生之一,$\widetilde{B}$表示事件$B$发生和不发生之一。有独立性的定义可推至$P(\widetilde{A}\widetilde{B})=P(\widetilde{A})P(\widetilde{B})$(一共有四个等式 [if and only if (iff)])。可推广至:
$$
P(\widetilde{A}_1\widetilde{A}_2…\widetilde{A}_n)=P(\widetilde{A}_1)…P(\widetilde{A}_n)
$$
上面有$2^n$个等式。
**注:**独立(independent)和不相容(exclusive)是不同的两个概念,前者有公共部分,后者没有公共部分,独立一定相容。
1.8.1 独立事件的条件概率 Conditional Probability of Independent events
If $P(A)>0$, then the equivalent condition of events $A$ and $B$ being mutually independent
$$
P(B)=P(B|A)
$$
1.9 重要公式与结论
$$
\begin{align}
&(1)\ P(\overline{A})=1-P(A)\
\
&(2)\ P(A \cup B)=P(A)+P(B)-P(AB)\
\
&(3)\ P(A\cup B \cup C)=P(A)+P(B)+P©-P(AB)-P(AC)-P(BC)+P(ABC)\
\
&(4)\ P(A-B)=P(A)-P(AB)\
\
&(5)\ P(A\overline{B})=P(A)-P(AB),P(A)=P(AB)+P(A\overline{B}),\
&\ \ \ \ \ \ P(A\cup B)=P(A)+P(\overline{A}B)=P(AB)+P(A\overline{B})+P(\overline{A}B)\
\
&(6)\ P(\overline{A}1|B)=1-P(A_1|B),P(A_1\cup A_2|B)=P(A_1|B)+P(A_2|B)-P(A_1A_2|B)\
&\ \ \ \ \ P(A_1A_2|B)=P(A_1|B)P(A_2|A_1B)\
\
&(7)\ 若A_1,A_2,…A_n相独立,则P(\bigcap{i=1}^{n}A_i)=\prod_{i=1}^{n}P(A_i),P(\bigcup_{i=1}^{n}A_i)=\prod_{i=1}^{n}(1-P(A_i))
\end{align}
$$
Chapter 2 随机变量及其分布 Random Variables and Their Distribution
2.1 随机变量的概念 Random Variable
- 随机变量 Random variable:值随机会而定的变量,研究随机试验的一串事件。可按维数分为一维、二维至多维随机变量。按性质可分为离散型随机变量以及连续型随机变量。A random variable is a function that assigns numeric values to different events in a sample space.
- **分布 Distribution:**事件之间的联系,用来计算概率。
- 示性函数 Indication function:
$I_A(\omega)=\begin{cases}
1& \omega \in A \
0& \omega \notin A
\end{cases}$,事件$A$有随机变量$I_A$表示出来,$I_A$称为事件$A$的示性函数。
2.2 离散型随机变量及其分布 Discrete Random Variables
-
**离散型随机变量 discrete random variables:**设$X$为一随机变量,如果$X$只取有限个或可数个值,则称$X$为一个(一维)离散型随机变量。A random variable for which there exists a discrete set of numeric values is a discrete random variable.
-
**概率函数:**设$X$为一随机变量,其全部可能值为${a_1, a_2,…}$,则$p_i=P(X=a_i),i=1,2,…$称为$X$的概率函数。
-
**概率分布:**离散型随机变量的概率分布可以用分布表来表示:
可能值 $a_1$ $a_2$ … $a_i$ … 概率 $p_1$ $p_2$ … $p_i$ … -
概率分布函数 cumulative-distribution function:
-
**定义:**设$X$为一随机变量,则函数
$$
F(X)=P(X\leq x)\quad(-\infty<x<\infty)
$$称为$X$的分布函数。(注:这里并未限定$X$为离散型的,它对任何随机变量都有定义。)
-
性质:
- 单调性:$F(x)$是单调非降的:$\forall x_1<x_2$,有$F(x_1)\leq F(X_2)$.
- 有界性:$0 \leq F(x) \leq 1$;当$x \rightarrow \infty$时,$F(x)\rightarrow1$;当$x \rightarrow-\infty$时,$F(x)\rightarrow0$.
- 右连续性:$\forall x_0, \lim_{x\to x_0+0}F(x)=F(x_0)$, that is, $F(x)$ is a right continuous function. $F(x)$右连续非左连续。
-
Relationship between probability and distribution function:
$$
\begin{align}
&(1)\ P{a<X\leq b}=P{X\leq b}-P{X\leq a}=F(b)-F(a)\
\
&(2) P{X>a}=1-P{X\leq a}=1-F(a)\
\
&(3) P{X<a}=\lim_{x\to a-0}P{X\leq x}=\lim_{x\to a-0}F(x)\
\
&(4) P{X\geq a}=1-P{X<a}=1-\lim_{x\to a-0}F(x)\
\
&(5) P{X=a}=P{X\leq a}-P{X<a}=F(a)-\lim_{x\to a-0}F(x)\
\end{align}
$$ -
离散型随机变量分布函数:
对于离散型随机变量,$F(X)=P(X\leq x)=\sum_{(i|a_i\leq x)}p_i$, $p_i=P(X=i)=F(i)-F(i-1)$。
-
-
伯努利分布(Bernoulli’s distribution)
-
**定义:**A discrete random variable $X$ is said to follow the Bernoulli’s distribution, which is denoted by $X \sim B(1,p)$, if $P{X=1}=p,P{X=0}=1-p.\ (0<P<1)$
-
Bernoulli’s distribution is associated with the trial which has only two possible outcomes ($A$ and $\overline{A}$) that are not necessarily equally likely.
-
Let the random variable $X={ the\ number\ of\ outcome\ A\ occurs}$. Then
$$
X=\begin{cases}1 & \text{if outcome A occurs} \0 & \text{if outcome A does not occur}\end{cases}
$$
-
-
二项分布(Binomial distribution)
-
**定义:**设某事件$A$在一次试验中发生的概率为$p$,先把试验独立地重复n次,以$X$记$A$在这n次试验中发生的次数,则$X$取值$0,1,…,n$,且有
$$
P(X=k)=\binom{n}{k}p^k(1-p)^{n-k},\quad k=0,1,…,n
$$称$X$服从二项分布,记为$X\sim B(n,p)$.
-
**服从二项分布的条件:**1. 各次试验的条件是稳定的,即事件$A$的概率$p$在各次试验中保持不变;2. 各次试验的独立性
-
The most probable value 最可能值:
$$
k_0=\begin{cases}(n+1)p-1\ or\ (n+1)p & \text{when (n+1)p is an integer}\\ [(n+1)p] & \text{when (n+1)p is not an integer} \end{cases}
$$- Proof:
$$
\begin{aligned}
& C_n^{k_0} p^{k_0}(1-p)^{n-k_0} \geq C_n^{k_0-1} p^{k_0-1}(1-p)^{n-k_0+1} \Rightarrow p(n+1) \geq k_0 \
& C_n^{k_0} p^{k_0}(1-p)^{n-k_0} \geq C_n^{k_0+1} p^{k_0+1}(1-p)^{n-k_0-1} \Rightarrow k_0 \geq p(n+1)-1
\end{aligned}
$$
- Proof:
-
-
泊松分布(Poisson distribution)
-
**定义:**设随机变量$X$的概率分布为
$$
P(X=i)=\frac{\lambda^i}{i!}e^{-\lambda},\quad i=0,1,2,…,\quad\lambda>0
$$则称$X$服从参数为$\lambda$的Poisson分布,并记$X\sim P(\lambda)$.
-
特点:
-
描述稀有事件发生概率
-
作为二项分布的近似。若$X\sim B(n,p)$,其中$n$很大,$p$很小,而$np=\lambda$不太大时(一般$n>30,np\leq5$),则$X$的分布接近泊松分布$P(\lambda)$. Binomial distribution: there are a finite number of trials n, and the number of events can be no larger than n. Poisson distribution: the number of trials is essentially infinite and the number of events can be indefinitely large.
-
Theorem: Let $\lambda > 0$ be a constant. Suppose $n$ is any positive integer and $\lambda=n p_n$. Then for any nonnegative integer $k$, we have
$$
\begin{gathered}
\lim _{n \rightarrow \infty} C_n^k p_n^k\left(1-p_n\right)^{n-k}=\frac{\lambda^k}{k!} e^{-\lambda} \
B(n, p) \rightarrow P(\lambda) \text { as } n \rightarrow \infty, p \rightarrow 0, np \rightarrow \lambda
\end{gathered}
$$The Poisson approximation theorem suggests: If $n$ is large and $p$ is small (generally $n \geq 30, p \leq 0.2$), we have
$$
\begin{gathered}
C_n^k p^k(1-p)^{n-k} \approx \frac{\lambda^k}{k!} e^{-\lambda} \quad \text { with } \lambda=n p \
\text { i. } e ., \quad B(n, p) \approx P(\lambda)
\end{gathered}
$$
-
-
推导:
若事件$A\sim B(n,p)$,且$n$很大,$p$很小,而$np=\lambda$不太大时,设$\lambda=np$,
$$
\begin{align}
P(X=i)&=\lim_{n\rightarrow \infty}\binom{n}{i}(\frac{\lambda}{n})^i(1-\frac{\lambda}{n})^{n-i}\
&=\lambda^i\lim_{n\rightarrow \infty}\frac{\binom{n}{i}}{n^i}\lim_{n\rightarrow \infty}(1-\frac{\lambda}{n})^{n-i}\
&=\lambda^i e^{-\lambda}\lim_{n\rightarrow \infty}\frac{n(n-1)(n-2)…(n-i+1)}{i!n^i}\
&=\lambda^i e^{-\lambda}\lim_{n\rightarrow \infty}\frac{(1-\frac{1}{n})(1-\frac{2}{n})…(1-\frac{i-1}{n})}{i!}\
&=\frac{\lambda^i}{i!}e^{-\lambda}
\end{align}
$$
-
2.3 连续型随机变量及其分布 Continuous Random Variables
-
**连续型随机变量 continuous random variable:**设$X$为一随机变量,如果$X$不仅有无限个而且有不可数个值,则称$X$为一个连续型随机变量。A random variable whose possible values cannot be enumerated is a continuous random variable.
-
概率密度函数 probability-density function:
-
**定义:**The probability density function $f(x)$ of the continuous random variable $X$ is a function whose integral from $x=a$ to $x=b$ $(\forall a,b\in R\ and\ b\geq a)$ gives the probability that $X$ takes a value in the interval $(a,b]$, i.e. 设连续型随机变量$X$有概率分布函数$F(x)$,则$F(x)$的导数$f(x)=F’(x)$称为$X$的概率密度函数。
$P{a<X\leq b}=\int_{a}^{b}f(X),dx$
-
性质:
- $F(x)$ is a continuous function;
- 对于任意的$-\infty<a\leq b<+\infty$,有$P(a\leq X\leq b)=F(b)-F(a)=\int_{a}^{b}f(x)dx$;
- $F’(x)=f(x)$;
- 对于任意的$-\infty<x<+\infty$,有$P(X=x)=\int_{x}^{x}f(u)du=0$.
-
注:
- 对于所有的$-\infty<x<+\infty$,有$f(x)\ge 0$;
- $\int_{-\infty}^{+\infty}f(x)dx=1$;
- 假设有总共一个单位的质量连续地分布在$a\leq x\leq b$上,那么$f(x)$表示在点$x$的质量密度且$\int_{c}^{d}f(x)dx$表示在区间$[c, d]$上的全部质量。
-
-
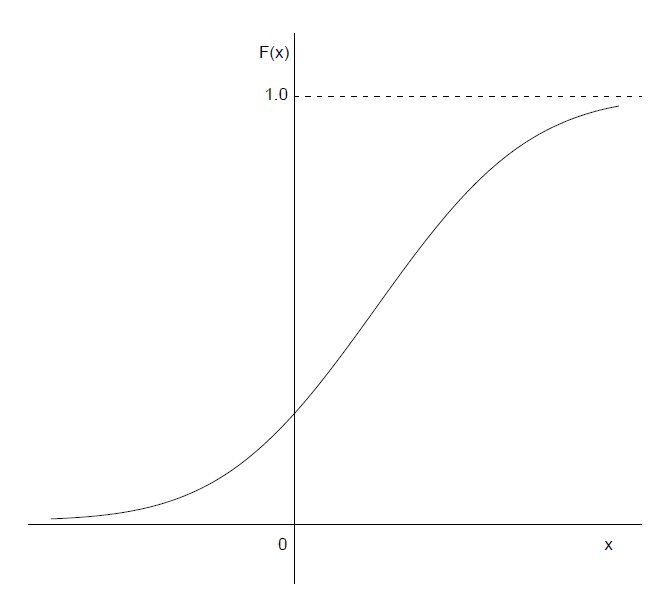
**概率分布函数 cumulative-distribution function:**设$X$为一连续型随机变量,则
$$
F(x)=\int_{-\infty}^xf(u)du,\quad-\infty<x<+\infty
$$ -
正态分布(Normal distribution):
-
**定义:**如果一个随机变量具有概率密度函数
$$
f(x)=\frac{1}{\sqrt{2\pi}\sigma}e^{-\frac{(x-\mu)^2}{2\sigma^2}},\quad -\infty<x<+\infty
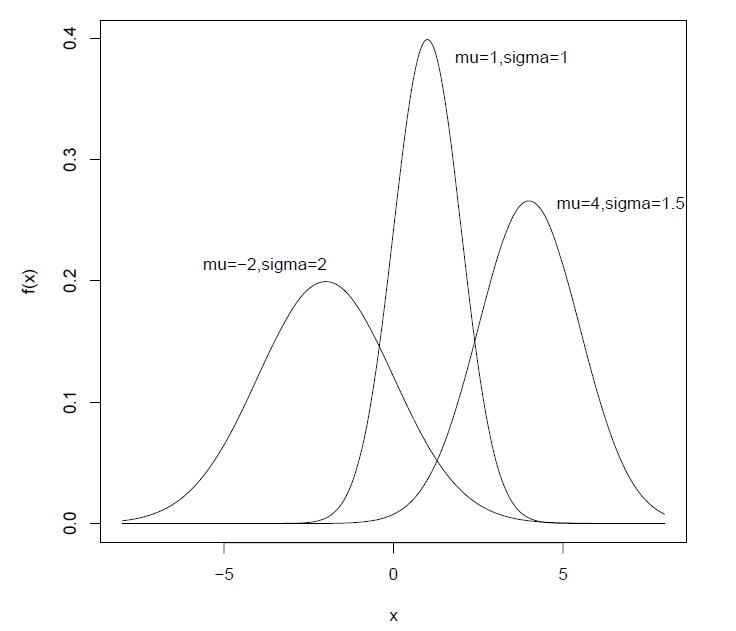
$$其中$-\infty<\mu<+\infty,\ \sigma^2>0$,则称$X$为正态随机变量,并记为$X\sim N(\mu,\sigma^2)$.特别地,$\mu=0,\sigma=1$的正态分布成为标准正态分布。用$\Phi(x)$和$\phi(x)$表示标准正态分布$N(0,1)$的分布函数和密度函数。
-
The distribution function of normal distribution is
$$
F(x)=\int_{-\infty}^x \frac{1}{\sqrt{2 \pi} \sigma} e^{-\frac{(t-\mu)^2}{2 \sigma^2}} d t, \quad-\infty<x<+\infty
$$From the symmetry of density function of normal distribution, we know that $F(\mu)=0.5$ 2. We indicated that parameters $\mu, \sigma^2$ are, respectively, the expected value and variance of the normal distribution, i.e., if $X \sim N\left(\mu, \sigma^2\right)$, then $E(X)=\mu,\ D(X)=\sigma^2$ 3. A normal distribution with parameters $\mu, \sigma^2$ is completely determined by its expected value and variance.
-
性质:
- 正态分布的密度函数是以$x=\mu$为对称轴的对称函数,$\mu$称为位置参数,密度函数在$x=\mu$处达到最大值,在$(-\infty,\mu)$和$(\mu,+\infty)$内严格单调。
- $\sigma$的大小决定了密度函数的陡峭程度,通常称$\sigma$为正态分布的形状参数。
- 若$X\sim N(\mu,\sigma^2)$,则$Y=(X-\mu)/\sigma\sim N(0,1)$.
- $\Phi(-k)=1-\Phi(k)$
-
Theorem:
- 有限个相互独立且服从正态分布的随机变量,其任意线性组合也服从正态分布。
- If $X \sim N(\mu,\sigma^2)$, then for any constants $a$, $b$, $aX+b \sim N(a\mu+b,a^2\sigma^2)$
- If $X\sim N(\mu_1,\sigma^2_1), Y\sim N(\mu_2,\sigma^2_2)$, and $X$ and $Y$ are independent variables, then $X±Y\sim N(\mu_1±\mu_2,\sigma^2_1±\sigma^2_2)$
- 有限个相互独立且服从正态分布的随机变量,其任意线性组合也服从正态分布。
-
Standard normal distribution 标准正态分布:
-
定义:A normal distribution with mean 0 and variance 1 is called a standard normal distribution. This distribution is denoted by $N(0,1)$.
-
In general, $\phi(x)$ and $\Phi(x)$ are used to represent density function and distribution function of a standard normal distribution, respectively, that is,
$$
\phi(x)=\frac{1}{\sqrt{2\pi}}e^{-\frac{x^2}{2}},&-\infty<x<+\infty\
\Phi(x)=\int^{x}_{-\infty}\frac{1}{\sqrt{2\pi}}e^{-\frac{t^2}{2}},dt&-\infty<x<+\infty
$$ -
The standard normal distribution is symmetric about $x = 0$.
-
Thanks to the widespread use of normal distribution, values of normal distribution function $\Phi(x)=\int_{-\infty}^x \frac{1}{\sqrt{2 \pi}} e^{-\frac{t^2}{2}} dt$ are tabulate for positive values of $x$. The table is called normal table.
$$
\Phi(x)=P{X \leq x}=\text { area to the left of } x
$$Obviously, $\Phi(0)=0.5$.
If $X \sim N(0,1)$, then $P{a<X \leq b}=\Phi(b)-\Phi(a)$
-
For the negative values of x, since symmetry properties of standard normal distribution and the area between the density curve and x-axis of equals 1, it follows that $\Phi(-x)=1-\Phi(x)$.
-
-
Conversion from an $N(\mu,\sigma^2)$ distribution to an $N(0,1)$ distribution:
-
We convert the normal variable $X$ to its standardized variable $U=\frac{X-\mu}{\sigma}$, then we have
$$
U = \frac{X-\mu}{\sigma}\sim N(0,1)
$$ -
Theorem: If $X \sim N\left(\mu, \sigma^2\right)$ and $F(x)$ is the distribution function of $X$, then
$$
F(x)=\Phi\left(\frac{x-\mu}{\sigma}\right)
$$Proof:
-
$$
F(x)=P(X \leq x)=P\left(\frac{X-\mu}{\sigma} \leq \frac{x-\mu}{\sigma}\right)=P\left(U \leq \frac{x-\mu}{\sigma}\right)=\Phi\left(\frac{x-\mu}{\sigma}\right) .
$$-
- If $X \sim N\left(\mu, \sigma^2\right)$, then
$$
\begin{gathered}
P(a<X \leq b)=F(b)-F(a)=\Phi\left(\frac{b-\mu}{\sigma}\right)-\Phi\left(\frac{a-\mu}{\sigma}\right) \
P(X>x)=1-F(x)=1-\Phi\left(\frac{x-\mu}{\sigma}\right)
\end{gathered}
$$- Probabilities for any normal distribution can now be evaluated using the normal table. 3. If $X \sim N\left(\mu, \sigma^2\right)$, then
$$
\begin{aligned}
P{\mu-k \sigma \leq X \leq \mu+ k \sigma} & =\Phi\left(\frac{\mu+k \sigma-\mu}{\sigma}\right)-\Phi\left(\frac{\mu-k \sigma-\mu}{\sigma}\right) \
& =\Phi(k)-\Phi(-k)=\Phi(k)-[1-\Phi(k)] \
& =2 \Phi(k)-1
\end{aligned}
$$When $k=1,2,3$,
$$
\begin{gathered}
P{\mu-\sigma \leq X \leq \mu+\sigma}=2 \Phi(1)-1=0.6827=68.27 % \
P{\mu-2 \sigma \leq X \leq \mu+2 \sigma}=2 \Phi(2)-1=0.9545=95.45 % \
P{\mu-3 \sigma \leq X \leq \mu+3 \sigma}=2 \Phi(3)-1=0.9973=99.73 %
\end{gathered}
$$ -
Upper percentile of standard normal distribution
-
Definition: Given $\alpha$ and $X \sim N(0,1)$, if
$$
P\left{X>u_\alpha\right}=\int_{u_\alpha}^{+\infty} \frac{1}{\sqrt{2 \pi}} e^{-\frac{x^2}{2}} d x=\alpha
$$then $u_\alpha$ is called the upper $100 \times \alpha$th percentile 上侧 $\alpha$ 分位数 or critical value 临界值 of a standard normal distribution $N(0,1)$.
-
Given $\alpha$, it follows that $\Phi(u_\alpha)=P{X \leq u_\alpha}=1-P{X>u_\alpha}=1-\alpha$. And $u_\alpha$ can be obtained from referring to normal table.
For example, if $\alpha=0.05$, then $ Phi(u*\alpha)=1-0.05=0.95$. Refer to normal table, $u*\alpha=1.645$.
-
Assume $X \sim N(\mu,\sigma^2 )$. If $P{X>x_0}=\alpha$ then $x_0$ is the upper $100 \times \alpha$th percentile or critical value of a normal distribution $N(\mu,\sigma^2 )$
$$
\text{i.e.,}\ \Phi(\frac{x_0 - \mu}{\sigma})=1-\alpha,\ \frac{x_0 + \mu}{\sigma}=u_\alpha,\ x_0=\mu + u_\alpha \sigma
$$
-
-
- 图像(密度和分布函数图):
- 指数分布(Exponential distribution):
-
**定义:**若随机变量$X$具有概率密度函数
$$
f(x)=
\begin{cases}
\lambda e^{-\lambda x}& x>0 \
0& x\leq 0
\end{cases}
=\lambda e^{-\lambda x}I_{(0,\infty)}(x)
$$其中$\lambda >0$为常数,则称$X$服从参数为$\lambda$的指数分布,并记$X\sim E(\lambda)$。
-
概率分布函数:
$F(x)=\begin{cases}
1-e^{-\lambda x}& x>0 \
0& x\leq 0
\end{cases}=(1-e^{-\lambda x})I_{(0,\infty)}(x)$
-
性质:
-
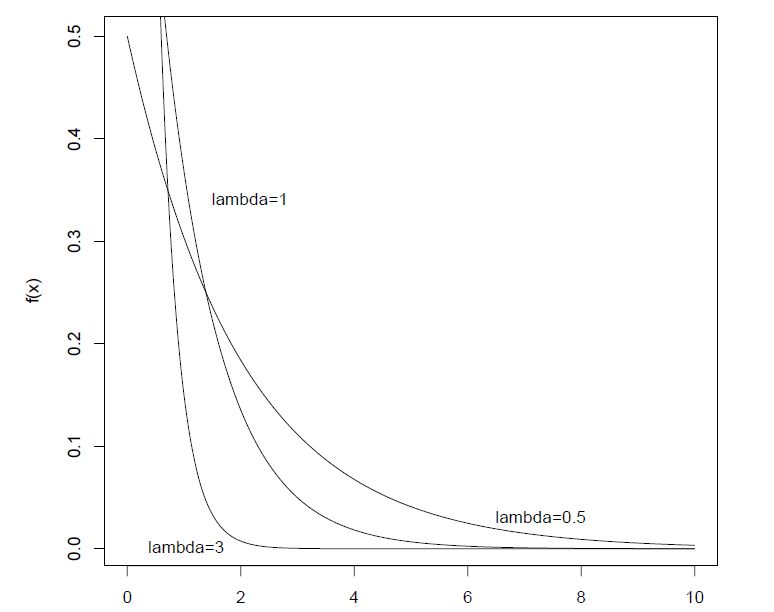
无后效性(Memoryless Property),即无老化,要来描述寿命(如元件等)的分布。
证明:
“无老化”就是说在时刻$x$正常工作的条件下,其失效率总保持为某个常数$\lambda>0$,与$x$无关,可表示
$$
\begin{align}
&P(x\leq X\leq x+h|X>x)/h=\lambda\quad(h\rightarrow0)\
证:\
&\lim_{h\rightarrow0}\frac{P(x\leq X\leq x+h|X>x)}{h}\
=&\lim_{h\rightarrow0}\frac{P(x\leq X\leq x+h,X>x)}{P(X>x)h}\
=&\lim_{h\rightarrow0}\frac{P(x< X\leq x+h)}{P(X>x)h}\
=&\lim_{h\rightarrow0}\frac{-e^{-\lambda t}|^{x+h}{x}}{-e^{-\lambda t}|^{\infty}{x}h}\
=&\lim_{h\rightarrow0}\frac{e^{-\lambda x}-e^{-\lambda x-\lambda h}}{e^{-\lambda x}h}\
=&\lim_{h\rightarrow0}\frac{1-\frac{1}{e^{xh}}}{h}\
=&\lim_{h\rightarrow0}\lambda e^{-\lambda h}\
=&\lambda
\end{align}
$$ -
$\lambda$为失效率,失效率越高,平均寿命就越小。
-
-
图像(密度函数):
-
均匀分布(Uniform distribution):
-
**定义:**设$a<b$,如果分布$F(x)$具有密度函数
$$
f(x)=
\begin{cases}
\frac{1}{b-a}& a\leq x\leq b \
0& 其它
\end{cases}
=\frac{1}{b-a}I_{(a,b)}(x)
$$则该分布为区间$[a,b]$上的均匀分布,记$X\sim U[a,b]$。
-
概率分布函数:
$$
F(x)=\begin{cases}
0& x\leq a \
\frac{x-a}{b-a}& a<x\leq b\
1 &x>b
\end{cases}
$$ -
性质:$\forall R(c,d) \subset R(a,b),\ P(c<X<d)=\frac{d-c}{b-a}$
-
数学期望:
$$
E(X)=\int_{-\infty}^{\infty}xf(x),dx=\int_{-a}^{b}x\times\frac{1}{b-a},dx=\frac{1}{b-a}\int_{a}^{b}x,dx=\frac{a+b}{2}
$$
-
2.4 多维随机变量(随机向量)
-
**随机向量:**设$X={X_1,…,X_n}$.如果每个$X_i$都是一个随机变量,$i=1,…,n$,则称$X$为$n$维随机变量或者随机向量。
-
**离散型随机向量的分布:**如果每一个$X_i$都是一个离散型随机变量,$i=1,…,n$,则称$X={X_1,…,X_n}$为一$n$维离散型随机变量。设$X_i$的所有可能取值为${a_{i1},a{i2},…},\quad i=1,…,n$,则称
$$
p(j_1,…,j_n)=P(X_1=a_{1j_1},…,X_n=a_{nj_n}),\quad j_1,…,j_n=1,2,…
$$为$n$维随机变量$X$的概率函数,这也是其联合分布。
其具有下列性质:
- $p(j_1,…,j_n)\geq0,\quad j_i=1,2,…,\quad i=1,2,…,n;$
- $\sum_{j_1,…,j_n}p(j_1,…,j_n)=1.$
**注:**对于高维离散型随机变量,一般不使用分布函数
-
多项式分布
-
**定义:**设$A_1,A_2,…,A_n$是某一试验之下的完备事件群,分别以$p_1,p_2,…,p_n$记事件$A_1,A_2,…,A_n$的概率,则$p_i\geq 0,\quad p_1+…+p_n=1$.将试验独立地重复$N$次,以$X_i$记在这$N$次试验中事件$A_i$出现的次数$(i=1,…,n)$,则$X=(X_1,…,X_n)$为一个$n$维随机向量。该分布记作$M(N;p_1,…,p_n)$.
-
概率分布函数:$P(X_1=k_1,X_2=k_2,…,X_n=k_n)=\frac{N!}{k_1!k_2!..k_n!}p_1^{k_1}p_2^{k_2}…p_n^{k_n}$
-
-
连续型随机向量的分布:$X={X_1,…,X_n}$为$n$维连续型随机变量,如果存在$\R^n$上的非负函数$f(x_1,…,x_n)$,使得对任意的$-\infty<a_1\leq b_1<+\infty,…,-\infty<a_n\leq b_n <+\infty$,有
$$
P(a_1\leq X_1 \leq b_1,…,a_n\leq X_n\leq b_n)=\int_{a_n}^{b_n} …\int_{a_1}^{b_1}f(x_1,…,x_n)dx_1…dx_n
$$则称为$f$为$X$的概率密度函数。有
$$
P(a_1\leq X_1 \leq b_1,…,a_n\leq X_n\leq b_n)=F(x_1,…,x_n)
$$则称为$F$为$X$的(联合)分布函数。其中分布函数$F(X_1,…,X_n)$具有下述性质:
- $F(x_1,…,x_n)$单调非降;
- 对任意的$1\leq j \leq n$,有$\lim_{x_j\rightarrow-\infty F(x_1,…,x_n)}=0$;
- $\lim_{x_1\rightarrow\infty,…,x_n\rightarrow\infty}F(x_1,…,x_n)=1$
-
**边缘分布:**因为$X$的每个分量$X_i$都是一维随机变量,故它们都有各自的分布$F_i\ (i=1,…,n)$,这些都是一维分布,称为随机向量$X$或其分布$F$的边缘分布。
-
离散型随机向量
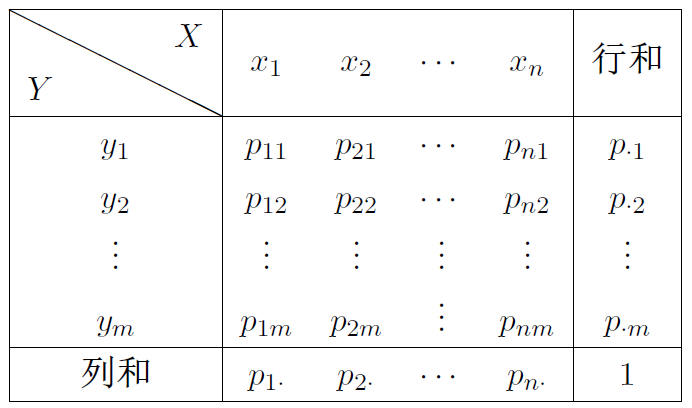
行和与列和就是边缘分布。即固定某个$x_i$,即可计算边缘分布,故有
$$
p_X(x_i)=P(X=x_i)=\sum_{j}^{m}P(X=x_i,Y=y_j)=\sum_{j}^{m}p_{ij}=p_{i\cdot},\quad i=1,2,…,n\
p_Y(y_i)=P(Y=y_i)=\sum_{i}^{m}P(X=x_i,Y=y_j)=\sum_{i}^{m}p_{ij}=p_{j\cdot},\quad j=1,2,…,n
$$ -
连续型随机向量
为求某分量$X_i$的概率密度函数,只需把$f(x_1,…,x_n)$中的$x_i$固定,然后对$x_1,…,x_{i-1},x_{i+1},…,x_n$在$-\infty$到$\infty$之间做定积分,如
$$
(X,Y)\sim f(x, y)\
f_X(u)=\int^{+\infty}{-\infty}f(u,v)dv\
f_Y(u)=\int^{+\infty}{-\infty}f(u,v)du\
$$
-
**注:**二维正态分布$N(a,b,\sigma_1^2,\sigma_2^2,\rho )$的边缘分布密度分别是一维正态分布$N(a,\sigma_1^2)$和$N(b,\sigma_2^2)$。因此联合分布可推边缘分布,而边缘分布不可推联合分布。
2.5 条件分布和随机变量的独立性
-
**离散型随机变量的条件分布:**设$(X,Y)$为二维离散型随机变量,对于给定的事件${Y=y_j}$,其概率$P(Y=y_j)>0$,则称
$$
P(X=x_i|Y=y_j)=\frac{P(X=x_i,Y=y_j)}{P(Y=y_j)}=\frac{p_{ij}}{p_{\cdot j}},\quad i=1,2,…
$$为在给定$Y=y_j$的条件下$X$的条件分布律。类似的,称
$$
P(Y=y_i|X=x_j)=\frac{P(X=x_i,Y=y_j)}{P(X=x_j)}=\frac{p_{ij}}{p_{i\cdot}},\quad j=1,2,…
$$为在给定$X=x_j$的条件下$Y$的条件分布律。
-
**连续型随机变量的条件分布:**设$(X,Y)$为二维连续型随机变量,对于给定条件$Y=y$下的条件概率密度为
$$
f_{X|Y}(x|y)=\frac{f(x,y)}{f_Y(y)}, \quad f_Y(y)>0.\
$$类似的,在$X=x$下的条件概率密度为
$$
f_{Y|X}(y|x)=\frac{f(x,y)}{f_X(x)}, \quad f_X(x)>0.\
$$二维正态分布$\rho=0$时,其联合密度分布等于条件密度分布的乘积。
-
随机变量的独立性
称随机变量$X_1, …,X_n$相互独立,
-
离散型随机变量
则联合分布律等于各自的边缘分布律的乘积,即
$$
P(X_1=x_1,…,X_n=x_n)=P(X_1=x_1)…P(X_n=x_n)
$$其中$(x_1,…x_n)$为$(X_1,…,X_n)$的值域中的任意一点。
-
连续型随机变量
则联合密度等于各自的边缘密度的乘积,即
$$
f(x_1,…,x_n)=f_1(x_1)…f_n(x_n),\quad \forall(x_1,…,x_n)\in \R ^n
$$ -
更具一般地
设$X_1,…,X_n$为$n$个随机变量,如果它们的联合分布函数等于各自边缘分布函数的乘积,即
$$
F(X_1, …,x_n)=F_1(x_1)…F_n(x_n),\quad \forall (x_1,…,x_n)\in \R^n
$$则称随机变量$X_1, …,X_n$相互独立。
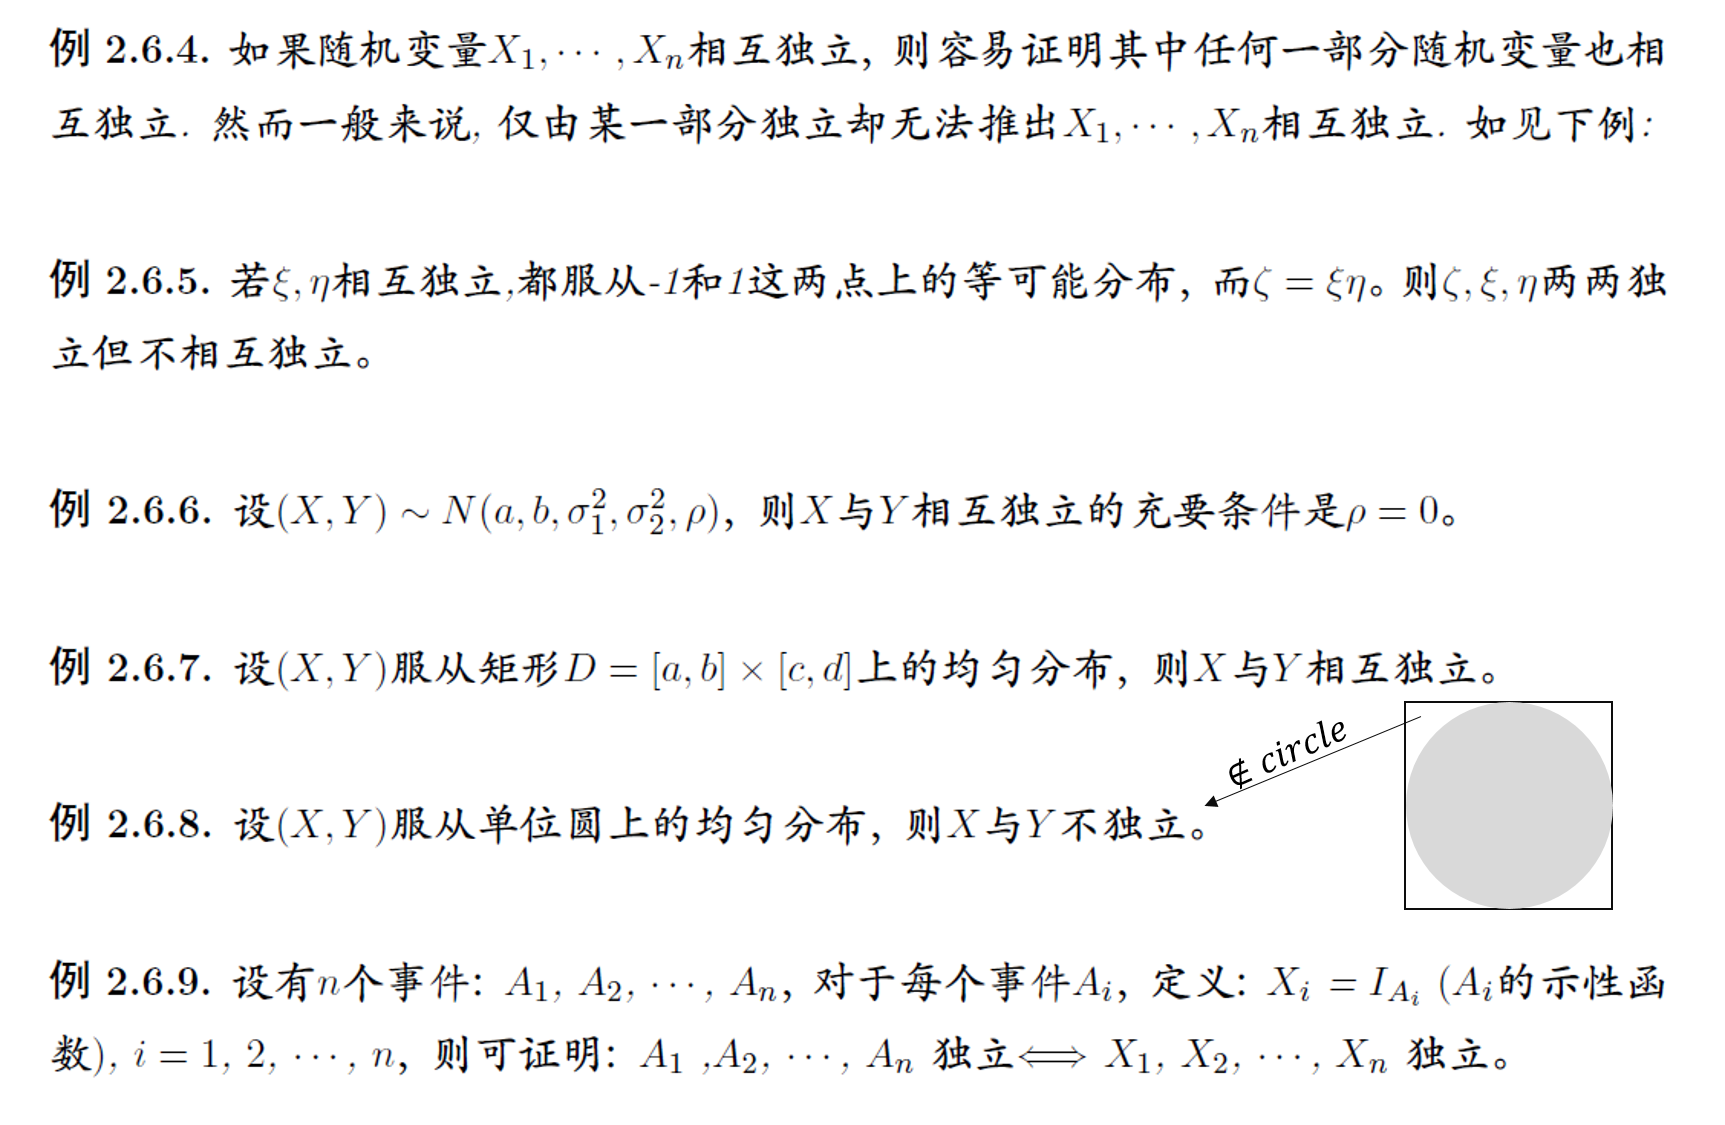
一些重要的结论
-
2.6 随机变量的函数的概率分布
最简单的情形,是由一维随机变量$X$的概率分布去求其一给定函数$Y=g(X)$的分布。较为常见的,是由$(X_1,X_2,…,X_n)$的分布去求$Y=g(X_1,X_2,…,X_n)$的分布。更一般地,由$(X_1,X_2,…,X_n)$的分布去求$(Y_1,Y_2,…,Y_m)$的分布,其中$Y_i=g_i(X_1,X_2,…,X_n),\quad i=1,2,…,m$.
-
**离散型分布的情形:**设$X$的分布律为$P(X=x_i)=p_i,\quad i=1,2,…$
$g:R\rightarrow R$,令$Y=g(X)$,则$Y$的分布律为
$$
P(Y=y_j)=P(g(X)=y_j)=\sum_{x_i:g(x_i)=y_j}P(X=x_i)=\sum_{i:g(x_i)=y_j}p_i
$$即把$Y=g(X_1,…,X_n)$可以取的不同值找出来,把与某个值相应的全部$(X_1,…,X_n)$值的概率加起来,即得$Y$取这个值的概率。
-
连续型分布的情形
-
一个变量的情况
设$X$有密度函数$f(x)$.设$Y=g(x)$,$g$是一个严格单调的函数,即当$x_1<x_2$时,必有$g(x_1)<g(x_2)$或当$x_1>x_2$时,必有$g(x_1)>g(x_2)$.又设$g$的导数$g’$存在。由于$g$的严格单调性,其反函数$X=h(Y)$存在,且$h$的导数$h’$也存在。有$g(X)$的密度函数$l(y)$为
$$
l(y)=f(h(y))|h’(y)|.
$$ -
多个变量的情形
以两个为例,设$(X_1,X_2)$的密度函数$f(x_1,x_2)$,$Y_1,Y_2$都是$(X_1,X_2)$的函数:
$$
Y_1=g_1(X_1,X_2),\quad Y_2=g_2(X_1,X_2),
$$要求$(Y_1,Y_2)$的概率密度函数$l(y_1,y_2)$.假定$(X_1,X_2)$到$(Y_1,Y_2)$的一一对应变换有逆变换:
$$
X_1=h_1(Y_1,Y_2),\quad X_2=h_2(Y_1,Y_2)
$$即雅可比行列式
$$
J(y_1,y_2)=\begin{vmatrix}
\partial h_1/\partial y_1&\partial h_1/\partial y_2 \
\partial h_2/\partial y_1&\partial h_2/ \partial y_2
\end{vmatrix}
$$不为0.在$(Y1,Y2)$的平面上任取一个区域$A$,变换后到$(X_1,X_2)$平面的区域$B$,则有
$$
P((Y_1,Y_2)\in A)=P((X_1,X_2)\in B)=\iint_Bf(x_1,x_2)dx_1dx_2\
P((Y_1,Y_2)\in A)=\iint_Af(h_1(y_1,y_2),h_2(y_1,y_2))|J(y_1,y_2)|dy_1dy_2
$$ -
随机变量和的密度函数
设$(X_1,X_2)$的联合密度函数为$f(x_1,x_2)$,$Y=X_1+X_2$的密度函数:
- 一般的,$l(y)=\int_{-\infty}^\infty f(x_1,y-x_1)dx_1=\int_{-\infty}^\infty f(x,y-x)dx$.
- 若$X_1,X_2$独立,则$l(y)=\int_{-\infty}^\infty f_1(x)f_2(y-x)dx=\int_{-\infty}^\infty f_1(y-x)f_2(x)dx$.
两个独立的正态变量的和仍服从正态分布,且有关的参数相加,其逆命题也成立。
-
随机变量商的密度函数
设$(X_1,X_2)$的联合密度函数为$f(x_1,x_2)$,$Y=X_1/X_2$的密度函数:- 一般的,$l(y)=\int_{0}^\infty x_1f(x_1,x_1y)dx_1$.
- 若$X_1,X_2$独立,则$l(y)=\int_{0}^\infty x_1f_1(x_1)f_2(x_1y)dx_1$.
-
-
统计学三大分布
引入两个重要的特殊函数:
$\Gamma(x)=\int_0^\infty e^{-t}t^{x-1}dt\quad (x>0)$ 和 $B(x,y)=\int_0^1t^{x-1}(1-t)^{y-1}dt\quad (x>0,y>0)$
其中,$\Gamma(1)=1,\quad \Gamma(1/2)=\sqrt{\pi},\quad \Gamma(n)=(n-1)!$
$B(x,y)=\Gamma(x)\Gamma(y)/\Gamma(x+y)$
-
卡方分布,记作$\chi_n^2$
密度函数:$k_n(x)=\frac{1}{\Gamma(\frac{n}{2}2^{n/2})}e^{-x/2}x^{(n-2)/2}I_{(0,\infty)}(x)$
**性质:**1. 设$X_1,X_2$独立,$X_1\sim\chi_m^2,X_2\sim\chi_n^2$,则$X_1+X_2\sim\chi_{m+n}^2$
- 若$X_1,…,X_n$独立,且都服从指数分布,则$X=2\lambda(X_1+…+X_n)\sim\chi_{2n}^2$
-
$t$分布,记作$t_n$
设$X_1,X_2$独立,$X_1\sim\chi_n^2,X_2\sim N(0,1)$,而$Y=X_2/\sqrt{X_1/n}$,则$Y\sim t_n$.
密度函数:$t_n(y)=\frac{\Gamma((n+1)/2)}{\sqrt{n\pi}\Gamma(n/2)}(1+\frac{y^2}{n})^{(\frac{n+1}{2})}$
**性质:**密度函数关于原点对称,其图形与正态分布$N(0,1)$的密度函数的图形相似。
-
$F$分布,记作$F_{mn}$
设$X_1,X_2$独立,$X_1\sim\chi_n^2,X_2\sim\chi_m^2$,而$Y=m^{-1}X_2/(n^{-1}X_1)$,则$Y\sim F_{mn}$
密度函数:$f_{mn}(y)=m^{m/2}n^{n/2}\frac{\Gamma(\frac{m+n}{2})}{\Gamma(\frac{m}{2})\Gamma(\frac{n}{2})}y^{m/2-1}(my+n)^{-(m+n)/2}\quad (y>0)$
三大分布的几个重要性质
- 设$X_1,…,X_n$独立同分布,有公共的正态分布$N(\mu,\sigma^2)$.记$\bar{X}=(X_1+…+X_n),S^2=\sum_{i=1}^{n}(X_i-\bar(X))^2/(n-1)$.则$(n-1)S^2/\sigma^2=\sum_{i=1}^{n}(X_i-\bar{X})^2/\sigma^2\sim\chi_{n-1}^{2}$.
- 设$X_1,…,X_n$的假定同1,则$\sqrt{n}(\bar{X}-\mu)/S\sim t_{n-1}$
- 设$X_1,…,X_n,Y_1,…,Y_m$独立,$X_i$各有分布$N(\mu1,\sigma_1^2)$,$Y_j$各有分布$N(\mu_2,\sigma_2^2)$,则
$$
[\sum_{j=1}^m(Y_j-\bar{Y})^2/(\sigma_2^2(m-1))]/[\sum_{i=1}^n(X_i-\bar{X})^2/(\sigma_1^2(n-1))]\sim F_{m-1,n-1}
$$
若$\sigma_1^2=\sigma_2^2$,则
$$
\sqrt{\frac{nm(n+m-2)}{n+m}}[(\bar{X}-\bar{Y})-(\mu_1-\mu_2)]/[\sum_{i=1}^{n}(X_i-\bar{X})^2+\sum_{j=1}^m(Y_j-\bar{Y})^2]^{1/2}\sim t_{n+m-2}
$$
-
Chapter 3 随机变量的数字特征 Numerical Features of Random Variables
3.1 数学期望 Expected Value
-
数学期望 Expected Value
-
**定义:**设随机变量$X$只取有限个可能值$a_1,…,a_m$,其概率分布为$P(X=a_i)=p_i\ (i=1,…,m)$. 则$X$的数学期望记作$E(X)^*$或$E(X)$,定义为$E(X)=a_1p_1+a_2p_2+…+a_mp_m$. 数学期望也常称为”均值“,即指以概率为权的加权平均。
-
离散型变量的数学期望:$E(X)=\sum^\infty_{i=1}a_ip_i.$(当级数绝对收敛,即$\sum_{i=1}^\infty|a_i|p_i<\infty$)
-
连续型变量的数学期望:$E(X)=\int_{-\infty}^\infty xf(x)dx$.(当$\int_{-\infty}^\infty |x|f(x)dx<\infty$)
-
常见分布的数学期望:
-
泊松分布:$E(X)=\lambda$.
$$
E(X)=\sum_{k=0}^{+\infty} k \frac{\lambda^k}{k!} e^{-\lambda}=\sum_{k=1}^{+\infty} \frac{\lambda^k}{(k-1)!} e^{-\lambda}=\lambda e^{-\lambda} \sum_{k=1}^{+\infty} \frac{\lambda^{k-1}}{(k-1)!}=\lambda e^{-\lambda} e^\lambda=\lambda .
$$i.e., $E(X)=\lambda$.
注: $e^\lambda$ 的幂级数展开式:
$$
\begin{array}{ll}
e^\lambda=1+\lambda+\frac{\lambda^2}{2!}+\frac{\lambda^3}{3!}+\cdots+\frac{\lambda^k}{k!}+\cdots=\sum_{k=0}^{+\infty} \frac{\lambda^k}{k!}, & \lambda \in(-\infty,+\infty) \
e^\lambda=\sum_{k=0}^{+\infty} \frac{\lambda^k}{k!}=\sum_{k=1}^{+\infty} \frac{\lambda^{k-1}}{(k-1)!}=\sum_{k=2}^{+\infty} \frac{\lambda^{k-2}}{(k-2)!}, & \lambda \in(-\infty,+\infty)
\end{array}
$$ -
二项分布:$E(X)=np$.
-
均匀分布:$E(X)=\frac{1}{2}(a+b)$.
-
指数分布:$E(X)=\lambda^{-1}$.
-
正态分布:$E(X)=\mu$.
-
卡方分布:$E(X)=n$.
-
$t$分布:$E(X)=0 \quad (n>1)$.
-
$F$分布:$E(X)=n/(n-2)\quad (n>2)$.
-
-
性质:
- 若干个随机变量之和的期望等于各变量的期望值和,即
$$
E(X_1+X_2+…+X_n)=E(X_1)+E(X_2)+…+E(X_n).
$$ - 若干个独立随机变量之积的期望等于各变量的期望之积,即
$$
E(X_1X_2…X_n)=E(X_1)E(X_2)…E(X_n).
$$ - $E(aX+b)=\int_{-\infty}^{\infty}(ax+b)f(x),d(x)=aE(x)+b$.
- 设随机变量$X$为离散型,有分布$P(X=a_i)=p_i(i=1,2,…)$;或者为连续型,有概率密度函数$f(x)$. 则
$$
E(g(x))=\sum_ig(a_i)p_i\quad (当\sum_i|g(a_i)|p_i<\infty时) \
或\
E(g(x))=\int_{-\infty}^\infty g(x)f(x)dx \quad (当\int_{-\infty}^{\infty}|g(x)|f(x)dx<\infty时)
$$- 若$c$为常数,则$E(cX)=cE(X)$.
- 若$c$为常数,则$E©=c$.
- 若干个随机变量之和的期望等于各变量的期望值和,即
-
-
条件数学期望
- **定义:**随机变量Y的条件期望就是它在给定的某种附加条件下的数学期望。$E(Y|x)=\int_{-\infty}^{\infty}yf(y|x)dy$.它反映了随着$X$取值$x$的变化$Y$的平均变化的情况如何。在统计上,常把条件期望$E(Y|x)$作为$x$的函数,称为$Y$对$X$的回归函数。
- 性质:
- $E(Y)=\int_{-\infty}^{\infty}E(Y|x)f_X(x)dx$.
- $E(Y)=E[E(Y|X)]$.
-
中位数
- **定义:**设连续型随机变量$X$的分布函数为$F(x)$,则满足条件$P(X\leq m)=F(m)=1/2$的数$m$称为$X$或分布$F$的中位数。即$m$这个点把$X$的分布从概率上一切两半。
- 性质:
- 与期望值相比,中位数受特大值或特小值影响很小,而期望不然。
- 中位数可能不唯一,且在某些离散型情况下,中位数不能达到一分两半的效果。
3.2 方差与矩
-
方差与标准差
-
**定义:**设$X$为随机变量,分布为$F$,则$D(X)\ or\ Var(X)=E(X-E(X))^2$称为$X$(或分布$F$)的方差,其平方根$\sqrt{Var(X)}$(取正值)称为$X$(或分布$F$)的标准差。
$$
E(X-E(X))^2=E(X^2-2XE(X)+(E(X))^2)
\=E(X^2)-2E(X)E(X)+E^2(X)=E(X^2)-(E(X))^2
$$ -
常见分布的方差:
-
泊松分布:$Var(X)=\lambda$.
$$
\begin{aligned}
& \begin{aligned}
E\left(X^2\right) & =\sum_{k=0}^{+\infty} k^2 \frac{\lambda^k}{k!} e^{-\lambda} \
& =\sum_{k=1}^{+\infty} k \frac{\lambda^k}{(k-1)!} e^{-\lambda}=e^{-\lambda} \sum_{k=1}^{+\infty}(k-1+1) \frac{\lambda^k}{(k-1)!} \
& =\lambda^2 e^{-\lambda} \sum_{k=2}^{+\infty} \frac{\lambda^{k-2}}{(k-2)!}+\lambda e^{-\lambda} \sum_{k=1}^{+\infty} \frac{\lambda^{k-1}}{(k-1)!} \
& =\lambda^2 e^{-\lambda} e^\lambda+\lambda e^{-\lambda} e^\lambda=\lambda^2+\lambda
\end{aligned} \
& Var(X)=E\left(X^2\right)-[E(X)]^2=\lambda^2+\lambda-\lambda^2=\lambda
\end{aligned}
$$ -
二项分布:$Var(X)=np(1-p)$.
-
正态分布:$Var(X)=\sigma^2$.
-
指数分布:$Var(X)=1/\lambda^2$.
-
均匀分布:$Var(X)=(b-a)^2/12$.
-
卡方分布:$Var(X)=2n$.
-
$t$分布:$Var(X)=n/(n-2)$.
-
$F$分布:$Var(X)=2n^2(m+n-2)/[m(n-2)^2(n-4)]\quad (n>4)$.
-
-
性质:
- $Var(X)=E(X^2)-(EX)^2$.
- 常数的方差为0,即$Var©=0$.
- 若$c$为常数,则$Var(X+c)=Var(X)$.
- 若$c$为常数,则$Var(cX)=c^2Var(X)$.
- 独立随机变量和的方差等于各变量方差和,即$Var(X_1+…+X_n)=Var(X_1)+…+Var(X_n)$.
- If $X$ is discrete random variable, which has probability distribution $P{X=x_k}=p_k$, $k=1,2,…$, then $E(X^2)=\sum_{i=1}^{\infty}x_k^2p_k$.
- If $X$ is continuous random variable, which has probability density function $f(x)$, then $E(X^2)=\int_{-\infty}^{\infty}x^2f(x),dx$.
-
-
矩
-
**定义:**设$X$为随机变量,$c$为常数,$k$为正整数。则量$E[(X-c)^k]$称为$X$关于$c$点的$k$阶矩。特别地,有两种重要的情况:
(1) $c=0$ .这时$a_k=E(X^k)$称为$X$的$k$阶原点矩。
(2)$c=E(X)$.这时$\mu_k=E[(X-EX)^k]$称为$X$的$k$阶中心矩。
一阶原点矩就是期望,一阶中心距$\mu_1=0$,二阶中心距$\mu_2$就是$X$的方差$Var(X)$.
-
两种重要应用:
- 偏度系数:$\beta_1=\mu_3/\mu_2^{3/2}$.衡量概率分布函数$f(x)$是否关于均值对称。如果$\beta>0$,则称分布为正偏或右偏;如果$\beta<0$,则称分布为负偏或左偏;如果$\beta=0$,则对称。(注:$\mu_2^{3/2}$为标准差的三次方,可将$\mu_3$缩放到一次因次)
- 峰度系数:$\beta_2=\mu_4/\mu_2^2$.衡量概率分布函数$f(x)$在均值附近的陡峭程度。若$X$有正态分布$N(\mu,\sigma^2)$,则$\beta_2=3$.(注:$\mu_2^2$为标准差的四次方,将$\mu_4$缩放到一次因次。为了迁就正态分布,也常定义$\mu_4/\mu_2^2-3$为峰度系数,以使正态分布的峰度系数为0)
-
3.3 协方差与相关系数
两者都反映了随机变量之间的关系。
-
协方差(Covariance)
- **定义:**称$E[(X-m_1)(Y-m_2)]$为$X$,$Y$的协方差,并记为$Cov(X,Y)$.
- 性质:
- $Cov(X,Y)$与$X,Y$的次序无关,即$Cov(X,Y)=Cov(Y,X)$.
- $Cov(c_1X+c_2,c_3Y+c_4)=c_1c_3Cov(X,Y)$.
- $Cov(X,Y)=E(XY)-E(X)E(Y)$.
- 若$X,Y$独立,则$Cov(X,Y)=0$.
- $[Cov(X,Y)]^2\leq \sigma_1^2\sigma_2^2$.等号当且仅当$X,Y$之间有严格线性关系($Y=a+bX$)时成立。
**注:**协方差的结果受随机变量量纲影响。
-
相关系数(Correlation coefficient)
- **定义:**称$Cov(X,Y)/(\sigma_1\sigma_2)$为$X,Y$的相关系数,并记为$Corr(X,Y)$.
- 性质:
- 若$X,Y$独立,则$Corr(X,Y)=0$.
- $-1\leq Corr(X,Y)\leq 1$,或$|Corr(X,Y)\leq 1|$,等号当且仅当$X$和$Y$有严格线性关系时达到。当$Corr(X,Y)=0$时,推出$X,Y$不线性相关。
注:相关系数常称为“线性相关系数”,实际上相关系数并不是刻画了$X,Y$之间消除量纲后“一般”关系的程度,而只是“线性关系的程度”。即使$X$与$Y$有某种严格的函数关系但非线性关系,$|Corr(X,Y)|$不仅不必为1,还可以为0.

3.4 大数定理和中心极限定理
-
大数定理
“大数”的意思,就是指涉及大量数目的观察值$X_i$,它表明这种定理中指出的现象只有在大量次数的试验和观察之下才能成立。
- **定义:**设$X_1,X_2,…,X_n,…$是独立同分布的随机变量,记它们的公共均值为$a$.又设它们的方差存在并记为$\sigma^2$.则对任意给定的$\varepsilon >0$,有$lim_{n\rightarrow\infty}P(|\bar{X}_n-a|\geq \varepsilon )=0$.(该式表明,当$n$很大时,$\bar{X}_n$接近$a$)
-
中心极限定理
即和的分布收敛于正态分布。
-
**定义:**设$X_1,X_2,…,X_n$为独立同分布的随机变量,$E(X_i)=a,Var(X_i)=\sigma^2(0<\sigma^2<\infty)$.则对任何实数$x$,有$lim_{n\rightarrow\infty}P(\frac{1}{\sqrt{n}\sigma}(X_1+…+X_n-na)\leq x)=\Phi(x)$.($\Phi(x)$为标准正态分布$N(0,1)$的分布函数)
-
**特例:**设$X_1,X_2,…,X_n$独立同分布,$X_i$分布是$P(X_i=1)=p$,$P(X_i=0)=1-p\ (0<p<1)$.则对任何实数$x$,有$lim_{n\rightarrow \infty}P(\frac{1}{\sqrt{np(1-p)}}(X_1+…+X_n-np)\leq x)=\Phi(x)$.
**注:**如果$t_1,t_2$是两个正整数,$t_1<t_2$.则当$n$相当大时,近似地有
$$
P(t_1\leq X_1+…+X_n\leq t_2)\approx \Phi(y_2)-\Phi(y_1),
$$其中
$$
y_i=(t_i-np)\sqrt{np(1-p)}\quad (i=1,2).
$$若把$y_1,y_2$修正为
$$
y_1=(t_1-\frac{1}{2}-np)/\sqrt{np(1-p)},\
y_2=(t_2-\frac{1}{2}-np)/\sqrt{np(1-p)}
$$在应用上式,则一般可提高精度。
-
Chapter 4 抽样分布 Sampling Distribution
4.1 总体与样本
- 总体
在一个统计问题里,研究对象的全体叫做总体,构成总体的每个成员称为个体。All the possible observations of a trial is called population. Each observation is called individual. 根据个体的数量指标数量,定义总体的维度,如每个个体只有一个数量指标,总体就是一维的,同理,个体有两个数量指标,总体就是二维的。总体就是一个分布,数量指标就是服从这个分布的随机变量。
总体根据个体数分为有限总体和无限总体,当有限总体的个体数充分大时,其可以看为无限总体。
As each individual of the population is the observation of a trial, it is also can be considered as the value of a certain random variable. Thus a population corresponds to a random variable $X$. From now on, we make no distinction between a population and a random variable, and it is generally referred to as population $X$ (笼统称为总体$X$)
- 参数 parameter: 总体X的数字特征即总体的特征指标。
-
样本
- 定义:
从总体中随机抽取的部分个体组成的集合称为样本,样本个数称为样本容量。
-
性质:
-
**二重性:**抽取前随机,是随机变量;抽取后确定,是一组数值。
-
**随机性:**每个个体都有同等的机会被选入样本。
-
-
**独立性:**每个样本的取值不影响其他样本取值,即分部独立。
满足后面两个性质称为简单随机样本,则
$$
F(x_1,x_2,…,x_n)=\prod^n_{i=1}F(x_i),\
f(x_1,x_2,…,x_n)=\prod^n_{i=1}f(x_i),\
p(x_1,x_2,…,x_n)=\prod^n_{i=1}p(x_i)
$$ -
样本容量 sample size: 样本中所含的个体数。当$n≥30$时,称为大样本,否则称为小样本。
-
简单随机样本 simple random sample: If carry out a trial repeatly and independently for n times and obtain n observations: $X_1,X_2,…,X_n$, Then these n observations $X_1,X_2,…,X_n$ can be regarded as $n$ random variables and is called a simple random sample 简单随机样本 of the population $X$, which has two properties:
- $X_1,X_2,…X_n$ are independent;
- $X_1,X_2,…X_n$ have the same distribution as the that of the population.
$X_is$ are independent and identically distributed (i.i.d.) 独立同分布.
-
分组样本
只知样本观测值所在区间,而不知具体值的样本称为分组样本。**缺点:**与完全样本相比损失部分信息。**优点:**在样本量较大时,用分组样本既简明扼要,又能帮助人们更好地认识总体。
4.2 样本数据的整理与显示
-
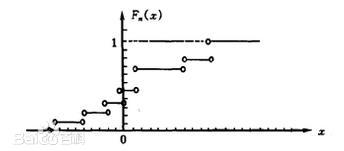
经验分布函数
若将样本观测值$x_1,x_2,…,x_n$由小到大进行排列,得到有序样本$x_{(1)}\leq x_{(2)}\leq…\leq x_{(n)}$,用有序样本定义如下函数
$$
F_n(x)=\left{\begin{matrix}
0 & 当x<x_{(1)}\
k/n & 当x_{(k)}\leq x<x_{(k+1)},k=1,2,…,n-1\
1 & 当x\geq x_{(n)}
\end{matrix}\right.
$$则称为$F_n(x)$为该样本的经验分布函数。
-
格里纹科定理
设$x_1,x_2,…,x_n$是取自总体分布函数为$F(x)$的样本,$F_n(x)$是该样本的经验分布函数,则当$n\rightarrow+\infty$时,有
$$
P(sup_{-\infty<x<+\infty}|F_n(x)-F(x)|\rightarrow0)=1
$$表明当n相当大时,经验分布函数$F_n(x)$是总体分布函数$F(x)$的一个良好的近似。它是经典统计学的一块基石。
-
频数频率分布表
有样本$x_1,x_2,…,x_n$制作频数频率分布表的操作步骤如下:
- 确定组数k;
- 确定每组组距,通常取每组组距相等为d(方便起见,可选为整数);
- 确定组限(下限$a_0$略小于最小观测值,上限$a_k$略大于最大观测值);
- 统计样本数据落入每个区间的频数,并计算频率。
该表能够简明扼要地把样本特点表示出来。不足之处是该表依赖于分组,不同的分组方式有不同的频数频率分布表。

-
直方图
- 利用频数频率分布表上的区间(横坐标)和频数(纵坐标)可作为频数直方图;
- 若把纵坐标改为频率就得频率直方图;
- 若把纵坐标改为频率/组距,就得到单位频率直方图。这时长条矩形的面积之和为1.

-
茎叶图
把样本中的每个数据分为茎与叶,把茎放于一侧,叶放于另一侧,就得到一张该样本的茎叶图。比较两个样本时,可画出背靠背的茎叶图。茎叶图保留数据中全部信息,当样本量较大,数据很分散,横跨二、三个数量级时,茎叶图并不适用。
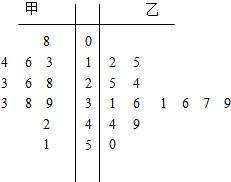
4.3 统计量及其分布
- 统计量
不含未知参数的样本函数称为统计量。统计量的分布称为抽样分布。
To perform statistical inference, we construct appropriate functions of the sample to draw conclusions rather than random sample itself. Let $X_1,X_2,…,X_n$ be a random sample drawn from population $X$. Then $\phi(X_1,X_2,…,X_n)$ is called a statistic 统计量, if $\phi(X_1,X_2,…,X_n)$ is just a function of $X_1,X_2,…,X_n$ without any unknown parameters 未知参数.
For example: Assume $X\sim N(\mu,\sigma^2)$ with parameter $\mu$ unknown and $\sigma$ known. Then $\sum_{i=1}^{n}(X_i-\bar{X})^2$ is a statistic but $\sum_{i=1}^{n}(X_i-\mu)$ is not a statistic.
- As $X_1,X_2,…,X_n$ are random variables, the statistic $\phi(X_1,X_2,…,X_n)$ is also a random variable.
- Let $X_1,X_2,…,X_n$ be a random sample drawn from population $X$. Frequently used statistics: sample mean and sample variance.
- When generally referring to a sampling results,sample $X_1,X_2,…,X_n$ are n random variables,and then $X$ and $S^2$ are also random variables. 当泛指一次抽样结果时,样本$X_1,X_2,…,X_n$是n个随机变量,则样本均值、样本方差等统计量也是随机变量;
- When specifically referring to a specific sampling results, observations $X_1,X_2,…,X_n$ are n specific numbers, and then $X$ and $S^2$ are also specific numbers.当特指一次具体的抽样结果时,样本值$X_1,X_2,…,X_n$是n个具体数值,从而样本均值$\bar{X}$、样本方差$S^2$等统计量也是具体的数值所以,后面不引起混淆的情况下,对样本和统计量赋予双重意义:泛指时为随机变量,特指时为相应数值。
-
抽样分布
Sampling distribution of a statistic: the distribution of the statistic. 统计量作为随机变量所服从的分布.
-
样本均值
-
定义:
样本$x_1,x_2,…,x_n$的算数平均值称为样本均值,记为$\bar{x}$.分组样本均值$\bar{x}=\frac{1}{n}\sum_{i=1}^{k}x_if_i$,其中n为样本量,k为组数,$x_i$与$f_i$为第i组的组中值和频率,分组样本均值是完全样本均值的一种较好的近似。
样本均值是样本的位置特征,样本中大多数值位于$\bar{x}$左右。平均可消除一些随机干扰,等价交换也是在平均数中实现的。
-
性质:
- $\sum_{i=1}^n (x_i-\bar{x})=0$,样本数据$x_i$对样本均值$\bar{x}$的偏差之和为零;
- 样本数据$x_i$与样本均值$\bar{x}$的偏差平方和最小,即对任意的实数c有$\sum_{i=1}^n(x_i-\bar{x})^2\leq \sum_{i=1}^n(x_i-c)^2$;
- 若总体分布为$N(\mu,\sigma^2)$,则$\bar{x}$的精确分布为$N(\mu,\sigma^2/n)$;
- 若总体分布未知,但其期望$\mu$与方差$\sigma^2$存在,则当n较大时,$\bar{x}$的渐进分布为$N(\mu,\sigma^2/n)$,这里渐进分布是指n较大时的近似分布。
The sampling distribution of sample mean (If population variance $\sigma^2$ is known)
Let $X_1, X_2, \ldots, X_n$ be a random sample from some population $X$ with mean $E(X)=\mu$ and variance $D(X)=\sigma^2$. Then
$$
E(\bar{X})=\mu \quad D(\bar{X})=\frac{\sigma^2}{n}
$$Because normal distribution is one of the most common distributions, we consider the sampling distribution of sample mean $\bar{X}$ with samples drawn from normal population.
Theorem: If $X_1, X_2, \ldots, X_n \sim N\left(\mu, \sigma^2\right)$ and are independent, then
$$
\bar{X} \sim N\left(\mu, \frac{\sigma^2}{n}\right)
$$If we standardize $\bar{X}$, then creating a new random variable
$$
U=\frac{\bar{X}-\mu}{\sigma / \sqrt{n}} \sim N(0,1)
$$
- 样本方差与样本标准差
样本方差有两种,$s_^2=\frac{1}{n}\sum_{i=1}^n(x_i-\bar{x})^2$与$s^2=\frac{1}{n-1}\sum_{i=1}^n(x_i-\bar{x})^2$,后者为无偏方差,也是最常用的。(这是因为当$\sigma^2$为总体方差时,总有$E(s_^2)=\frac{n-1}{n}\sigma^2$,$E(s^2)=\sigma^2$,表明$s_*^2$有系统偏小的误差,$s^2$无此系统偏差。)称$\sqrt{s^2}$为样本标准差。
样本方差是样本的散布特征,$s^2$越大样本越分散,$s^2$越小分布越集中,样本标准差比样本方差使用更频繁,因为前者和样本均值有着相同的单位。
$s^2$的计算有如下三个公式可供选用:
$$
s^2=\frac{1}{n-1}\sum(x_i-\bar{x})^2=\frac{1}{n-1}[\sum x_i^2-\frac{(\sum x_i)^2}{n}]=\frac{1}{n-1}(\sum x_i^2-n\bar{x}^2)
$$
在分组样本场合,样本方差的近似计算公式为
$$
s^2=\frac{1}{n-1}\sum_{i=1}^kf_i(x_i-\bar{x})^2=\frac{1}{n-1}(\sum_{i=1}^k f_ix_i^2-n\bar{x}^2)
$$
其中k为组数,$x_i,f_i$分别为第i个区间的组中值与频数,$\bar{x}$为分组样本的均值。
- 样本矩及其函数
- 样本的k阶原点矩$a_k=\frac{1}{n}\sum_{i=1}^{n}x_i^k$,样本均值$\bar{x}$为样本的一阶原点矩;
- 样本的k阶中心距$b_k=\frac{1}{n}\sum_{i=1}^n(x_i-\bar{x})^k$,样本方差$s^2$和$s_*^2$都为样本的二阶中心矩;
- 样本变异系数$C_r=s/\bar{x}$;
- 样本的偏度$\hat{\beta_s}=b_3/b_2^{3/2}$,反映样本数据与对称性偏离程度和偏离方向;
- 样本的峰度$\hat{\beta_k}=\frac{b_4}{b_2^2}-3$,反映总体分布密度曲线在其峰值附近的陡峭程度和尾部粗细.

-
次序统计量及其分布
设$x_1,…,x_n$是取自某总体的一个样本,$x_{(i)}$称为该样本的第i个次序统计量(升序排序后,第i个样本)。
-
$x_{(1)}=min{x_1,…,x_n}$称为该样本的最小次序统计量;
-
$x_{(n)}=max{x_1,…,x_n}$称为该样本的最大次序统计量;
-
$(x_{(1)},x_{(2)},…,x_{(n)}}$称为该样本的次序统计量,即不独立也不同分布;
-
$R=x_{(n)}-x_{(1)}$称为样本极差。
设总体$X$的密度函数为$f(x)$,分布函数为$F(x)$,$x_1,…,x_n$为样本,则有 -
样本第k个次序统计量$x_{(k)}$的密度函数为
$$
f_k(x)=\frac{n!}{(k-1)!(n-k)!}(F(x))^{k-1}(1-F(x))^{n-k}f(x);
$$ -
样本第i个与第j个次序统计量的联合密度函数为
$$
f_{ij}(y,z)=\frac{n!}{(i-1)!(j-i-1)!(n-j)!}(F(y))^{i-1}(F(z)-F(y))^{j-i-1}(1-F(z))^{n-j}f(xy)f(z),\quad y\leq z, 1\leq i<j\leq n
$$
-
-
样本中位数与样本分位数
设$x_1,…,x_n$是取自某总体的样本,$x_{(1)}\leq x_{(2)}\leq …\leq x_{(n)}$为该样本的次序统计量,则样本中位数$m_{0.5}$定义为
$$
m_{0.5}=\left{\begin{matrix}
x_{(\frac{n+1}{2})} & n为奇数\
\frac{1}{2}(x_{(\frac{n}{2})} + x_{(\frac{n}{2}+1)}) & n为偶数
\end{matrix}\right.
$$样本的p分位数$m_p$定义为
$$
m_{p}=\left{\begin{matrix}
x_{[np+1]} & np不是整数\
\frac{1}{2}(x_{(np)} + x_{(np+1)}) & np是整数
\end{matrix}\right.
$$其中[x]表示向下取整。中位数对样本的极端值有抗干扰性,或称有稳健性。
**样本分位数的渐近分布:**设总体的密度函数为$f(x)$,$x_p$为总体的p分位数。若$p(x)$在$x_p$处连续且$p(x_p)>0$,则当n充分大时,有$$
m_p\sim N(x_p,\frac{p(1-p)}{n\cdot p^2(x_p)}),\
m_{0.5}\sim N(x_{0.5},\frac{1}{4n\cdot p^2(x_{0.5})})
$$ -
五数概括与箱线图
五数指用样本的五个次序统计量,即最小观测值,最大观测值,中位数,第一4分位数和第三4分位数。其图形为箱线图,可描述样本分布形状。


4.4 $\chi^2$ Distributions
-
Definition: if $\chi^2=X_1^2+X_2^2+…+X_n^2$, where $X_1,X_2,…,X_n \sim N(0,1)$ and the $X_i$‘s are independent, then the statistic $\chi^2$ is said to follow a $\chi^2$ distribution with $n$ degrees of freedom, which is denoted by $\chi^2 \sim \chi^2(n)$.
-
The degree of freedom is the number of independent random variables in a statistic. It is often denoted by $d f$ and defined as follows:
$$
d f=n-r
$$Where $n$ is the number of random variables in a statistic, $r$ is the number of constraint conditions 约束条件 of these random variables.
For example: $\quad S^2=\frac{1}{n-1} \sum_{i=1}^n\left(X_i-\bar{X}\right)^2$
There are $n$ random variables $X_i-\bar{X}, \mathrm{i}=1, \ldots, \mathrm{n}$, and these random variables satisfy a constraint condition:$$
\sum_{i=1}^n\left(X_i-\bar{X}\right)=X_1+\cdots X_n-n \bar{X}=0
$$Thus, the degrees of freedom of $S^2$ is $d f=n-1$.
-
If $X \sim N(0,1)$, then $X^2 \sim \chi^2(1)$ 。
-
Assume $X \sim N\left(\mu, \sigma^2\right)$. First standardize $X$, $\frac{X-\mu}{\sigma} \sim N(0,1)$ then $\left(\frac{X-\mu}{\sigma}\right)^2 \sim \chi^2(1) .$
-
Properties
-
The chi-square distribution only takes positive values and is always skewed to the right.
-
The skewness diminishes as $n$ increases.
-
When $n \rightarrow+\infty$, the distribution of $\chi^2(n)$ approaches a normal distribution.
-
If $\chi_1^2 \sim \chi^2\left(n_1\right), \chi_2^2 \sim \chi^2\left(n_2\right)$ and $\chi_1^2$ and $\chi_2^2$ are independent, then
$$
\chi_1^2+\chi_2^2 \sim \chi^2\left(n_1+n_2\right)
$$
-
-
$E\left(\chi^2\right)=n, \quad D\left(\chi^2\right)=2 n$
-
Theorem 2: If $X_1, X_2, \ldots, X_n \sim N\left(\mu, \sigma^2\right)$ and are independent, then
- $\frac{(n-1) S^2}{\sigma^2} \sim \chi^2(n-1)$
- $\bar{X}$ and $S^2$ are independent.
- Remark: Standardize $X_i$, then $\frac{X_i-\mu}{\sigma} \sim N(0,1)$ and
$$
\sum_{\underline{i}=1}^n \frac{\left(X_i-\mu\right)^2}{\sigma^2} \sim \chi^2(n)
$$
However, if we substitute $\bar{X}$ for $\mu$ in the above equation, then we lose 1 degree of freedom (constraint condition: $\sum_{i=1}^n\left(X_i-\bar{X}\right)=X_1+\cdots X_n - n \bar{X}=0$).
i.e.,
$$
\sum_{i=1}^n \frac{\left(X_i-\bar{X}\right)^2}{\sigma^2} \sim \chi^2(n-1)
$$
Recall
$$
S^2=\frac{1}{n-1} \sum_{i=1}^n\left(X_i-\bar{X}\right)^2
$$
Thus
$$
\frac{(n-1) S^2}{\sigma^2}=\sum_{i=1}^n \frac{\left(X_i-\bar{X}\right)^2}{\sigma^2} \sim \chi^2(n-1)
$$
-
Upper percentile of a $\chi^2(n)$ distribution
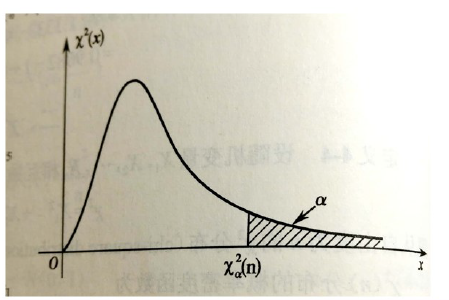
- Definition: The upper $100\times \alpha$th percentiles of a $\chi^(n)$ distribution (i.e., a chi-square distribution with $n\ df$) is denoted by $\chi^2_\alpha(n)$ where
$$
P{\chi^2>\chi^2_\alpha(n)}=\alpha
$$
4.5 $t$ 分布
If normal population variance $\sigma^2$ is known, then the sample mean $\bar{X} \sim N\left(\mu, \frac{\sigma^2}{n}\right) \quad \text { i.e., } \quad \frac{\bar{X}-\mu}{\sigma / \sqrt{n}} \sim N(0,1)$
If normal population variance $\sigma^2$ is unknown, which can be replaced by $S^2$, what will be the distribution of sample mean $\frac{\bar{X}-\mu}{S / \sqrt{n}}$?
-
Definition
If
$$
t=\frac{X}{\sqrt{Y / n}}
$$Where $X \sim N(0,1), Y \sim \chi^2(n)$ and $X$ and $Y$ are independent, then statistic $t$ is said to follow a $t$ distribution with $n$ degrees of freedom, which is denoted by $t \sim t(n)$.
-
Properties
- $t$ distribution is symmetric about 0 but is more spread out than the $N(0,1)$ distribution.
- As $n \rightarrow+\infty$, the $t$ distribution converges 收敛 to an $N(0,1)$ distribution.
- When $n$ is large enough ($n \geq 30$), $t$ distribution is approximated by a $N(0,1)$ distribution; when $n$ is small $(n<30)$, these two distributions make a large difference.
-
The sampling distribution of $\bar{X}$ (if $\sigma^2$ is unknown)
-
If population variance $\sigma^2$ is unknown, we replace population variance $\sigma^2$ with sample variance $S^2$, and we have the following theorem:
Theorem : If $X_1, X_2, \ldots, X_n \sim N\left(\mu, \sigma^2\right)$ with unknown $\sigma^2$ and they are independent, then
$$
\frac{\bar{X}-\mu}{S / \sqrt{n}} \sim t(n-1)
$$ -
Proof:
First$$
\frac{\bar{X}-\mu}{\sigma / \sqrt{n}} \sim N(0,1), \quad \frac{(n-1) S^2}{\sigma^2} \sim \chi^2(n-1)
$$and $\bar{X}$ and $S^2$ are independent.
Then by the definition of $t$ distribution,$$
\frac{\bar{X}-\mu}{\frac{\sigma}{\sqrt{n}}} / \sqrt{\frac{(n-1) S^2}{\sigma^2(n-1)}} \sim t(n-1)
$$
-
-
The sampling distribution of difference between two sample means
When studying the statistical inference of the means $\left(\mu_1, \mu_2\right)$ of two normal populations, it is necessary to investigate the distribution of the difference between the sample means $(\bar{X}, \bar{Y})$ of the two normal populations.
Theorem:
Suppose $X_1, X_2, \ldots, X_{n_1} \sim N\left(\mu_1, \sigma_1^2\right), Y_1, Y_2, \ldots, Y_{n_2} \sim N\left(\mu_2, \sigma_2^2\right)$ and these two random samples are independent. The means and variances in these two samples are denoted by $\bar{X}$. $\bar{Y}$ and $S_x^2, S_y^2$ respectively.-
Assume variances $\sigma_1^2,\sigma_2^2$ are known. Then
$$
\frac{(\bar{X}-\bar{Y})-(\mu_1-\mu_2)}{\sqrt{\frac{\sigma_1^2}{n_1}+\frac{\sigma_2^2}{n_2}}}\sim N(0,1)
$$ -
Assume variances $\sigma_1^2, \sigma_2^2$ are unknown but $\sigma_1^2=\sigma_2^2=\sigma^2$. Then
$$
\frac{(\bar{X}-\bar{Y})-\left(\mu_1-\mu_2\right)}{S \sqrt{\frac{1}{n_1}+\frac{1}{n_2}}} \sim t\left(n_1+n_2-2\right)
$$
where
$$
S^2=\frac{\left(n_1-1\right) S_x^2+\left(n_2-1\right) S_y^2}{n_1+n_2-2}
$$
In particular, when $n_1=n_2$, we get $S^2=\frac{S_x^2+S_y^2}{2}$. -
Proof:
Assume $\sigma_1^2=\sigma_2^2=\sigma^2$. Then $U=\frac{(\bar{X}-\bar{Y})-\left(\mu_1-\mu_2\right)}{\sigma \sqrt{\frac{1}{n_1}+\frac{1}{n_2}}} \sim N(0,1)$.
Besides,$$
\frac{\left(n_1-1\right) S_x^2}{\sigma^2} \sim \chi^2\left(n_1-1\right), \quad \frac{\left(n_2-1\right) S_y^2}{\sigma^2} \sim \chi^2\left(n_2-1\right)
$$and $S_x^2$ and $S_y^2$ are independent.
By the property of $\chi^2$ distribution, we obtain
$$
V=\frac{\left(n_1-1\right) S_x^2}{\sigma^2}+\frac{\left(n_2-1\right) S_y^2}{\sigma^2} \sim \chi^2\left(n_1+n_2-2\right)
$$Also $U 、 V$ are independent, then
$$
\frac{U}{\sqrt{V / n_1+n_2-2}}=\frac{(\bar{X}-\bar{Y})-\left(\mu_1-\mu_2\right)}{S \sqrt{\frac{1}{n_1}+\frac{1}{n_2}}} \sim t\left(n_1+n_2-2\right)
$$where $S^2=\frac{\left(n_1-1\right) S_x^2+\left(n_2-1\right) S_y^2}{n_1+n_2-2}$
-
-
Upper percentile of t distribution

-
Definition: The $100 \times \alpha$ th percentile of a $t$ distribution with $n$ degrees of freedom is denoted by $t_\alpha(n)$, where
$$
P\left{t>t_\alpha(n)\right}=\alpha
$$ -
- When $n \leq 45$ and $\alpha$ is small, we can refer to the value of $t_\alpha(n)$ from $t$ distribution table.
- When $\alpha$ is larger, it follows from the definition of upper percentile and the symmetry property of $t$ distribution that
$$
t_{1-\alpha}(n)=-t_\alpha(n)
$$- When $n>45, t_\alpha(n)$ can be approximated by the upper percentile of $N(0,1)$, that is,
$$
t_\alpha(n) \approx u_\alpha
$$
-
4.6 $F$ 分布 $F$ distribution
When studying the statistical inference of variances $(\sigma_1^2,\sigma_2^2)$of two normal populations, it is necessary to investigate the distribution of sample variances ratio $(S_1^2,S_2^2)$ of the two normal population.
First we introduce F distribution.
-
Definition:
If $F=\frac{X_1/n_1}{X_2/n_2}$
Where $X_1{\sim}\chi^2(n_1),X_2{\sim}\chi^2(n_2)$ and $X_1,X_2$ are independent, then $F$ is said to follow a $F$ distribution with $(n_1,n_2)$ degrees of freedom, which is denoted by $F\thicksim F(n_1,n_2)$ and $n_1$ is referred to as numerator 分子 $df$ and $n_2$ denominator 分母 $df$.
-
Remark:
- The F distribution is generally positively skewed and the shape of F distribution depends both on the numerator and denominator $df.$
- If a random variable $X\sim F(n_1,n_2)$, then $\frac1X{\sim}F(n_2,n_1)$
- Assume $T{\sim}t(n).$ Then $T^2{\sim}F(1,n)$. Recall: If $X\sim N(0,1)$, then $X^2\sim\chi^{2}(1).$
- Proof: If $T{\sim}t(n)$, then there exist $X{\sim}N(0,1),Y{\sim}\chi^{2}(n)$,and $X{、}Y$ are
independent such that
$$
T=\frac X{\sqrt{Y/n}}
$$
which gives
$$
T^2=\frac{X^2}{Y/n}
$$
here $X^2{\sim}\chi^2(1),Y{\sim}\chi^2(n)$, and $X^2,Y$ are independent, thus we get $T^2{\sim}F(1,n).$
-
The sampling distribution of two-sample variances ratio
-
Theorem:
Suppose $X_1, X_2, \ldots, X_{n_1} \sim N\left(\mu_1, \sigma_1^2\right), Y_1, Y_2, \ldots, Y_{n_2} \sim N\left(\mu_2, \sigma_2^2\right)$ and these two random samples are independent.
Also suppose the variances in these two samples are denoted by $S_x^2$, $S_y^2$ respectively. Then$$
F=\frac{S_x^2 / \sigma_1^2}{S_y^2 / \sigma_2^2} \sim F\left(n_1-1, n_2-1\right)
$$In particular, when $\sigma_1^2=\sigma_2^2$, we get $F=\frac{s_x^2}{s_y^2} \sim F\left(n_1-1, n_2-1\right)$
-
Proof:
First $\frac{\left(n_1-1\right) S_x^2}{\sigma_1^2} \sim \chi^2\left(n_1-1\right), \quad \frac{\left(n_2-1\right) S_y^2}{\sigma_2^2} \sim \chi^2\left(n_2-1\right)$, and $S_x^2$ and $S_y^2$ are independent.Using the definition of F distribution,
$$
\frac{\left(n_1-1\right) S_x^2}{\left(n_1-1\right) \sigma_1^2} / \frac{\left(n_2-1\right) S_y^2}{\left(n_2-1\right) \sigma_2^2} \sim F\left(n_1-1, n_2-1\right)
$$i.e.,
$$
\frac{S_x^2 / \sigma_1^2}{S_y^2 / \sigma_2^2} \sim F\left(n_1-1, n_2-1\right)
$$
-
-
Upper percentile of F distribution
-
Definition: The $100 \times \alpha$ th percentile of an $F$ distribution with $n_1, n_2$ degrees of freedom is denoted by $F_\alpha\left(n_1, n_2\right)$, where
$$
P\left{F>F_\alpha\left(n_1, n_2\right)\right}=\alpha
$$ -
Remark:
$$
F_{1-\alpha}\left(n_1, n_2\right)=\frac{1}{F_\alpha\left(n_2, n_1\right)}
$$- If $\alpha(=0.1,0.05,0.025,0.01)$ is small, then refer to $F$ table to get upper percentile of $F$ distribution.
- If $\alpha(=0.9,0.95,0.975,0.99)$ is larger, then use $F_{1-\alpha}\left(n_1, n_2\right)=$ $\frac{1}{F_\alpha\left(n_2, n_1\right)}$.
-
Proof: Using the definition of upper percentile of $F$ distribution, $P\left{F>F_{1-\alpha}\left(n_1, n_2\right)\right}=1-\alpha$, which derives
$$
P\left{\frac{1}{F}<\frac{1}{F_{1-\alpha}\left(n_1, n_2\right)}\right}=1-\alpha .
$$Then $P\left{\frac{1}{F}>\frac{1}{F_{1-\alpha}\left(n_1, n_2\right)}\right}=P\left{\frac{1}{F} \geq \frac{1}{F_{1-\alpha}\left(n_1, n_2\right)}\right}=\alpha$
Since $\frac{1}{F} \sim F\left(n_2, n_1\right)$, it follows that $F_\alpha\left(n_2, n_1\right)=\frac{1}{F_{1-\alpha}\left(n_1, n_2\right)}$
i.e., $F_{1-\alpha}\left(n_1, n_2\right)=\frac{1}{F_\alpha\left(n_2, n_1\right)}$.
-
Chapter 5 参数估计 Parameter Estimation
统计学与概率论的区别就是归纳和演绎,前者通过样本推测总体的分布,而后者已知总体分布去研究样本。因此参数估计则是归纳的过程,参数估计有两种形式:点估计和区间估计(点估计和区间估计都是对于未知参数的估计,而点估计给出的是一个参数可能的值,区间估计给出的是参数可能在的范围)。
- Point estimation 点估计: specify a values as the estimates of population unknown parameters. i.e., sample mean of a certain sampling can be the estimate of population mean.
- Interval estimation 区间估计:specify a range within which the true population parameter are likely to fall. This type of problem involves interval estimation.
5.1 点估计 Point Estimation
5.1.1 点估计的概念
**点估计(Point estimation):**设$x_1, …, x_n$是来自总体的一个样本,用于估计未知参数$\theta$的统计量$\hat{\theta}=\hat{\theta}(x_1,…,x_n)$成为$\theta$的估计量,或称为$\theta$的点估计。
Definition: Suppose $\theta$ is an unknown parameter of some population $X.$ Let $X_1,X_2,…,X_n$ be a random sample drawn from population $X$, and $x_1,x_2,…,x_n$ be a set of corresponding observations.
Now construct an appropriate statistic $\hat{\theta}(X_1,X_2,…,X_n)$ to estimate $\theta$ with its value $\hat{\theta}(x_1,x_2,…,x_n).$ Then the function $\hat{\theta}(X_1,X_2,…,X_n)$ is called an estimator 估计量 of $\theta$ and the value $\hat{\theta}(x_1,x_2,…,x_n)$ is called an estimate 估计值 of $\theta.$
- The estimator as a statistic is a random variable.
- The estimate of an estimator will vary with the different observations of sample.
5.1.2 点估计的方法
-
矩估计
Let $X_1, X_2, \ldots, X_n$ be a random sample drawn from some population which follows a uniform distribution over interval $[0, \theta]$. Find the estimator of unknown parameter $\boldsymbol{\theta}$.
To solve this problem, we need to introduce the method of moments 矩估计法.
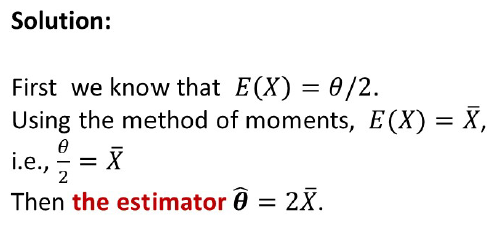
**定义:**设总体概率函数已知,为$p(x;\theta_1,…,\theta_k)$,$(\theta_1,…,\theta_k)\in\Theta$是未知参数或参数向量,$x_1,…,x_n$是样本,假定总体的$k$阶原点矩$\mu_k$存在,则对所有的$j$,$o<j<k$,$\mu_j$都存在,若假设$\theta_1,…,\theta_k$能够表示成$\mu_1,…,\mu_k$的函数$\theta_j=\theta_j(\mu_1,…,\mu_k)$,则可给出诸$\theta_j$的矩估计:
$$
\hat{\theta_j}=\theta_j(a_1,…,a_k),\quad j=1,…,k
$$其中$a_1,…,a_k$是前$k$阶样本原点矩$a_j=\frac{1}{n}\sum_{i=1}^{n}x_i^j$.
矩估计基于大数定律(格里纹科定理),实质是用经验分布函数去替换总体分布,矩估计可以概括为:
-
用样本矩代替总体矩(可以是原点矩也可以是中心矩);
- 用样本矩的函数去替换相应的总体矩的函数。
- $$\begin{aligned}&\textbf{Definition: }\text{The }k\text{th uncorrected moment k阶原点矩 of a random variable }X\mathrm{~is~}E(X^{k}).\&\textbf{Definition: }\text{The }k\text{th corrected moment k阶中心矩 of a random variable }X\mathrm{~is~}E[(X-E(X))^{k}].\end{aligned}$$
- The first uncorrected moment $E(X)$ is simply the expected value. The second corrected moment $E\left[(X-E(X))^2\right]$ is the variance. The second uncorrected moment $E\left(X^2\right)=D(X)+[E(X)]^2$.
-
The idea of the method of moments:
- The sample moment 样本矩 $\sum_{i=1}^nX_i^s/n,s=1,2,…$ is used as the estimator of the corresponding population moment 总体矩 $E(X^s).$
- $\begin{array}{lll}\text{Sample moment:}&\frac1n\sum_{i=1}^nX_i:,\frac1n\sum_{i=1}^nX_i^2:,\frac1n\sum_{i=1}^nX_i^3:,\ldots\\text{Population moment:}&E(X),E(X^2),E(X^3),\ldots\end{array}$
- Assume $F(x;\theta_1,\theta_2,…,\theta_r)$ is the distribution function of population $X$, where parameters $\theta_1,\theta_2,…,\theta_r$ are unknown. Also assume $E(X^k)(k=1,2,…,r)$ exist。
- The sample moment 样本矩 $\sum_{i=1}^nX_i^s/n,s=1,2,…$ is used as the estimator of the corresponding population moment 总体矩 $E(X^s).$
-
Using the method of moments, the moment estimators $\widehat{\theta}_1,\widehat{\theta}_2,…,\widehat{\theta}_r$ are obtained by equating the first r sample moments to the corresponding first r population moments and solving for $\theta_1,\theta_2,…,\theta_r$
$$
\left{\begin{aligned}
E(X)= & \frac{1}{n} \sum_{i=1}^n X_i \
E\left(X^2\right)= & \frac{1}{n} \sum_{i=1}^n X_i^2 \
& \ldots \
E\left(X^r\right)= & \frac{1}{n} \sum_{i=1}^n X_i^r
\end{aligned}\right.
$$ -
More precisely,
when estimating single parameter, it is suffice to solve the following single equation:
$$E(X)=\sum_{i=1}^nX_i/n=\bar{X}$$
When estimating two parameters, two estimating equations will be needed:
$$\begin{cases}E(X)=\dfrac{1}{n}\sum_{i=1}^nX_i\E(X^2)=\dfrac{1}{n}\sum_{i=1}^nX_i^2\end{cases}$$
-
**注:**矩估计可能是不唯一的,尽量使用低阶矩给出未知参数的估计 。
-
最大似然估计
**定义:**设总体的概率函数为$p(x;\theta),\ \theta\in\Theta$,其中$\theta$是一个未知参数或几个未知参数组成的参数向量,$\Theta$是参数空间,$x_1,…,x_n$是来自该总体的样本,将样本的联合概率函数看成$\theta$的函数,用$L(\theta;x_1,…,x_n)$表示,简记为$L(\theta)$,
$$
L(\theta)=L(\theta;x_1,…,x_n)=p(x_1;\theta)p(x_2;\theta)…p(x_n;\theta)
$$$L(\theta)$称为样本的似然函数。若统计量$\hat{\theta}=\hat{\theta}(x_1,…,x_n)$满足
$$
L(\hat{\theta})=\max_{\theta\in\Theta}L(\theta)
$$则称$\hat{\theta}$是$\theta$的最大似然估计,简称MLE(maximum likelihood estimate).
注:最大似然估计基于样本观测数据,根据概率论思想进行参数估计,首先抽取一定样本,默认这些样本的出现概率是符合原始分布的,即恰好抽到这些样本是因为这些样本出现的概率极大,然后根据概率密度计算联合概率,形成似然函数,似然函数极值位置即为参数的估计值。最大似然估计的前提是已知数据的分布。
最大似然估计步骤:
- 写出似然函数;
- 对似然函数取对数,并整理;
- 求参数向量的偏导,令其为0,得到似然方程;
- 求解似然方程,其解为参数值。
-
最小均方误差估计
在样本量一定时,评价一个点估计好坏的度量指标可使用估计值$\hat{\theta}$与参数真值$\theta$的距离函数,最常用的是距离平方,由于$\hat{\theta}$具有随机性,对该函数求期望即得均方误差:
$$
\begin{align}
MSE(\hat{\theta})&=E(\hat{\theta}-\theta)^2\
&=E[(\hat{\theta}-E\hat{\theta})+(E\hat{\theta}-\theta)]^2\
&=E(\hat{\theta}-E\hat{\theta})^2+(E\hat{\theta}-\theta)^2+\underbrace{2E[(\hat{\theta}-E\hat{\theta})(E\hat{\theta}-\theta)]}{E(\hat{\theta}-E\hat{\theta})=0}\
&=\underbrace{Var(\hat{\theta})}{点估计的方差}+\underbrace{(E\hat{\theta}-\theta)^2}_{偏差的平方}
\end{align}
$$其中,如果$\hat{\theta}$是$\theta$的无偏估计,则$MSE(\hat{\theta})=Var(\hat{\theta})$,此时用均方误差评价点估计与用方差是完全一样的。如果如果$\hat{\theta}$不是$\theta$的无偏估计,就要看其均方误差$MSE(\hat{\theta})$,即不仅要看其方差大小,还要看其偏差大小。
**定义:**设有样本$x_1,…,x_n$,对待估参数$\theta$,设有一个估计类,如果对该估计类中另外任意一个$\theta$的估计$\widetilde{\theta}$,在参数空间$\Theta$上都有$MSE_\theta(\hat{\theta})\leq MSE_\theta(\widetilde{\theta})$,称$\hat{\theta}(x_1,…,x_n)$是该估计类中$\theta$的一致最小均方误差估计。
-
最小方差无偏估计
定义:设$\hat{\theta}$是$\theta$的一个无偏估计,如果对另外任意一个$\theta$的无偏估计$\widetilde{\theta}$,在参数空间$\Theta={\theta}$上都有$Var_{\theta}(\hat{\theta})\leq Var_{\theta}(\widetilde{\theta})$,则称$\hat{\theta}$是$\theta$的一致最小方差无偏估计,简记为UMVUE。
**判断准则:**设$\hat{\theta}=\hat{\theta}(x_1,…,x_n)$是$\theta$的一个无偏估计,$Var(\hat{\theta})<+\infty$.如果对任意一个满足$E(\varphi(x_1,…,x_n))=0$的$\varphi$,都有
$$
Cov_\theta(\hat{\theta},\varphi)=0,\quad\forall\theta\in\Theta,
$$则$\hat{\theta}$是$\theta$的UMVUE.
-
贝叶斯估计
区别于频率学派,在统计推断中贝叶斯用到了三种信息:总体信息、样本信息和先验信息(频率学派只用了前两种),其中:
- 总体信息:总体信息即总体分布或总体所属分布族提供的信息,如,若已知总体是正态分布,则可以知道很多信息;
- 样本信息:样本信息即抽取样本所得观测值提供的信息,如,在有了样本观测值后,可以根据它知道总体的一些特征数;
- 先验信息:若把抽取样本看作做一次试验,则样本信息就是试验中得到的信息,如,在一次抽样后,这第一次的抽样就是先验信息。先验信息来源于经验和历史资料。
回顾贝叶斯公式:设${B_1, B_2, …B_n}$是样本空间的一个分割,$A$为$\Omega$中的一个事件,$P(B_i)>0$,$i=1,2,…,n$,$P(A)>0$,则
$$
P(B_i|A)=\frac{P(A|B_i)P(B_i)}{\sum_{j=1}^{n}P(A|B_j)P(B_j)}
$$贝叶斯密度函数形式:
-
在参数$\theta$分布已知(已假设)的情况下,$p(x|\theta)$表示随机变量$\theta$取某个给定值时总体的条件概率函数,(参考$P(A|B)$);
-
任一未知量$\theta$都可以看作随机变量,可用一个概率分布去描述,这个分布成为先验分布,该先验分布$\pi(\theta)$,(参考$P(B)$);
-
贝叶斯的观点,样本$X=(x_1,…,x_n)$的产生需分两步:
-
从先验分布$\pi(\theta)$产生一个样本$\theta_0$;
-
从$p(X|\theta_0)$中产生一组样本。
此时,样本$X=(x_1,…,x_n)$的联合条件概率函数(参考$\sum_{j=1}^{n}P(A|B_j)$)为
$$
p(X|\theta_0)=p(x_1,…,x_n|\theta_0)=\prod^{n}_{i=1}p(x_i|\theta_0)
$$-
因为$\theta_0$未知,是从先验分布$\pi(\theta)$中产生的,所以需要考虑它的发生概率,样本$X$和参数$\theta$的联合分布(参考$\sum_{j=1}^{n}P(A|B_j)P(B_j)$)为
$$
h(X,\theta)=p(X|\theta)\pi(\theta)
$$ -
因为目的是对$\theta$进行推断,所以在有样本观测值$X=(x_1,…,x_n)$之后,可依据$h(X,\theta)$对$\theta$作出推断,按照乘法公式(参考1.5.2节),$h(X,\theta)$可分解为
$$
h(X,\theta)=\pi(\theta|X)m(X)
$$其中,$m(X)$是$X$的边际概率函数,类比$\pi(\theta)$,
$$
m(X)=\int_\Theta h(X,\theta)d\theta=\int_\Theta p(X|\theta)\pi(\theta)d\theta
$$所以可通过条件概率$\pi(\theta|X)$推断$\theta$的分布
$$
\pi(\theta|X)=\frac{h(X,\theta)}{m(X)}=\frac{p(X|\theta)\pi(\theta)}{\int_{\Theta}p(X|\theta)\pi(\theta)d\theta}
$$该分布成为$\theta$的后验分布。它其实是利用总体和样本对先验分布$\pi(\theta)$调整的结果,比$\pi(\theta)$更接近$\theta$的实际情况(机器学习里的贝叶斯模型就是基于这样的原理)。
**Flag:**感觉贝叶斯定理很有意思,今后也会学习相关的贝叶斯分析数据,敬请期待~
5.1.3 点估计的优良性准则
-
**无偏性 Unbiasedness:**设$\hat{\theta}=\hat{\theta}(x_1,…,x_n)$是$\theta$的一个估计,$\theta$的参数空间为$\Theta$,若对任意的$\theta \in \Theta$,有
$$
E_{\theta}(\hat{\theta})=\theta
$$则称$\hat{\theta}$是$\theta$的无偏估计,否则称为有偏估计。无偏性的要求也可以改写为$E_{\theta}(\hat{\theta}-\theta)=0$,无偏性表示表示估计参数与真实参数没有系统偏差。Definition: An estimator $\hat{\theta}$ of a parameter $\theta$ is unbiased if $E(\hat{\theta})=\theta$. This means that the average value of $\hat{\theta}$ over a large number of repeated samples of size $n$ is $\theta$.
-
Sample mean $\bar{X}=\frac{1}{n} \sum_{i=1}^n X_i$ is an unbiased estimator of population mean $\mu$, i.e., $E(\bar{X})=\mu$.
-
Sample variance $S^2=\frac{1}{n-1} \sum_{i=1}^n\left(X_i-\bar{X}\right)^2$ is an unbiased estimator of population variance $\sigma^2$, i.e., $E\left(S^2\right)=\sigma^2$
-
Therefore in practice, we normally choose to use sample mean $\bar{X}$ 、 sample variance $S^2$ as the estimators of population mean $\mu$, population variance $\sigma^2$ respectively, i.e.,
$$
\hat{\mu}=\bar{X}, \quad \hat{\sigma}^2=S^2
$$**一个重要的结论:**样本均值$\bar{x}=\frac{1}{n}\sum_{i=1}^nx_i$是总体均值$\mu$的无偏估计。样本方差$s_n^2=\frac{1}{n}\sum_{i=1}^n(x_i-\bar{x})^2$不是总体方差$\sigma^2$的无偏估计(而是渐进无偏估计),因此需要对样本方差进行修正,$s^2=\frac{1}{n-1}\sum_{i=1}^n(x_i-\bar{x})^2$.
- 样本均值的无偏性推导
$$
\begin{align}
E(\bar{x})=&E(\frac{1}{n}\sum_{i=1}^nx_i)\
=&\frac{1}{n}\sum_{i=1}^nE(x_i),\ x_i为iid\
=&\frac{1}{n}\sum_{i=1}^n\mu\
=&\mu
\end{align}
$$- 样本方差的有偏性推导
$$
\begin{align}
E(s_n^2)=&E[\frac{1}{n}\sum_{i=1}^n(x_i-\bar{x})^2]\
=&E[\frac{1}{n}\sum_{i=1}^n((x_i-\mu)-\frac{1}{n}(\bar{x}-\mu))^2]\
=&E[\frac{1}{n}\sum_{i=1}^n((x_i-\mu)^2-\frac{2}{n}(x_i-\mu)(\bar{x}-\mu)+\frac{1}{n}(\bar{x}-\mu)^2)]\
=&E[\frac{1}{n}\sum_{i=1}^n(x_i-\mu)^2-\frac{2}{n}\sum_{i=1}^n(x_i-\mu)(\bar{x}-\mu)+(\bar{x}-\mu)^2],\ 其中,\bar{X}-\mu=\frac{1}{n}\sum_{i=1}^n(x_i-\mu)\
=&E[\frac{1}{n}\sum_{i=1}^n(x_i-\mu)^2-2(\bar{x}-\mu)^2+(\bar{x}-\mu)^2]\
=&E[\frac{1}{n}\sum_{i=1}^n(x_i-\mu)^2-(\bar{x}-\mu)^2]\
=&E[\frac{1}{n}\sum_{i=1}^n(x_i-\mu)^2]-E[(\bar{x}-\mu)^2]\
=&\sigma^2-E[(\bar{x}-\mu)^2]\ …(1)\
=&\sigma^2-\frac{\sigma^2}{n}\
=&\frac{n-1}{n}\sigma^2,\quad 当n\rightarrow \infty时, E(s_n^2)\rightarrow \sigma^2\
\
E[(\bar{x}-\mu)^2]=&E(\bar{x}^2)-2\mu E(\bar{x})+\mu^2\
=&E(\bar{x}^2)-\mu^2\
=&Var(\bar{x})+E^2(\bar{x})-\mu^2\
=&Var(x)\
=&\frac{\sigma^2}{n}\ …代入(1)式
\end{align}
$$
-
-
有效性 Effectiveness
In practice, it is desirable that not only the estimator is unbiased, but also the deviation between $\hat{\theta}$ and $\theta$ as small as possible.
If $\hat{\theta}$ is the unbiased estimator of $\theta$, that is $E(\hat{\theta})=\theta$, then
$$
E\left((\hat{\theta}-\theta)^2\right)=E\left((\hat{\theta}-E(\hat{\theta}))^2\right)=D(\hat{\theta})
$$This suggests the smaller the variance $D(\hat{\theta})$, the closer $\hat{\theta}$ is to $\theta$, the more effective $\hat{\theta}$ is.
In other words, smaller $D(\hat{\theta})$ implies the estimator $\hat{\theta}$ is more precise when estimating parameter $\theta$.
无偏估计往往有很多种,以总体均值为例,$x_1,…,x_n$是取自某总体的样本,样本均值$\mu$和样本$x_i$都是总体均值的无偏估计,对于两个估计参数的选取需要基于一个度量无偏估计优劣的准则。有效性作为这样的准则,反映了参数估计值和参数真值的波动,波动大小可用方差来衡量,波动越小表示参数的估计越有效。
设$\hat{\theta_1}$,$\hat{\theta_2}$是$\theta$的两个无偏估计,如果对任意的$\theta\in\Theta$有
$$
Var(\hat{\theta}_1)\leq Var(\hat{\theta}_2)
$$且至少有一个$\theta\in\Theta$使得上述不等号严格成立,则称$\hat{\theta}_1$比$\hat{\theta}_2$有效。
Definition: Suppose $\hat{\theta}_1 、 \hat{\theta}_2$ are two unbiased estimators of unknown population parameter $\theta$. If
$$
D\left(\hat{\theta}_1\right)<D\left(\hat{\theta}_2\right)
$$then $\hat{\theta}_1$ is said to be more effective than $\hat{\theta}_2$.
Conclusion:
In the unbiased estimators of the population mean $\mu$ expressed as
$$
\sum_{i=1}^n c_i X_i \text { (where } c_i \geq 0, \quad \sum_{i=1}^n c_i=1
$$the variance of the sample mean $\bar{X}$ is the smallest, so $\bar{X}$ is the most effective unbiased estimator for $\mu$.
Proof: 显然当 $c_i \geq 0, \sum_{i=1}^n c_i=1$ 时,有$\mathrm{E}\left(\sum_{i=1}^n c_i X_i\right)=E(X)=\mu$ ,即 $\sum_{i=1}^n c_i X_i$ 是 $\mu$ 的无偏估计。
又 $D\left(\sum_{i=1}^n c_i X_i\right)=\sum_{i=1}^n c_i^2 D\left(X_i\right)=\sigma^2 \sum_{i=1}^n c_i^2$
由均值不等式 $\sqrt{\frac{1}{n} \sum_{i=1}^n c_i^2} \geq \frac{1}{n} \sum_{i=1}^n c_i=\frac{1}{n^{\prime}} \quad$ 即 $\sum_{i=1}^n c_i^2 \geq \frac{1}{n}$
从而, $D\left(\sum_{i=1}^n c_i X_i\right)=\sigma^2 \sum_{i=1}^n c_i^2 \geq \frac{\sigma^2}{n}=D(\bar{X})$
其中在 $c_1=c_2=\cdots=c_n=\frac{1}{n^{\prime}}$ ,不等式取等号,即 $\sum_{i=1}^n c_i X_i$ 其中 $c_i \geq 0$ ,
$\sum_{i=1}^n c_i=1$ 中样本均值 $\bar{x}$ 的方差最小, $\bar{X}$ 是 $\mu$ 的最有效的无偏估计量。 -
相合性
根据格里纹科定理,随着样本量不断增大,经验分布函数逼近真实分布函数,即设$\theta\in\Theta$为未知参数,$\hat{\theta}_n=\hat{\theta}_n(x_1,…,x_n)$是$\theta$的一个估计量,$n$是样本容量,若对任何一个$\epsilon>0$,有
$$
\lim_{n\rightarrow\infty}P(|\hat{\theta}_n-\theta|\geq\epsilon)=0
$$则称$\hat{\theta}_n$为参数$\theta$的相合估计。
**定理1:**设$\hat{\theta}_n=\hat{\theta}n(x_1,…,x_n)$是$\theta$的一个估计量,若
$$
\lim{n\rightarrow\infty}E(\hat{\theta}n)=\theta,\quad\lim{n\rightarrow\infty}Var(\hat{\theta}_n)=0
$$则$\hat{\theta}_n$是$\theta$的相合估计。
**定理2:**若$\hat{\theta}{n1},…,\hat{\theta}{nk}$分别是$\theta_1,…,\theta_k$的相合估计,$\eta=g(\theta_1,…,\theta_k)$是$\theta_1,…,\theta_k$的连续函数,则$\hat{\eta}n=g(\hat{\theta}{n1},…,\hat{\theta}_{nk})$是$\eta$的相合估计。
矩估计一般都具有相合性:
- 样本均值是总体均值的相合估计;
- 样本标准差是总体标准差的相合估计;
- 样本变异系数$s/\bar{x}$是总体变异系数的相合估计。
-
渐进正态性(MLE)
在很一般条件下,总体分布$p(x;\theta)$中的$\theta$的MLE$\hat{\theta}_n$具有相合性和渐进正态性,即$\hat{\theta}n\sim AN(\theta,\frac{1}{nI(\theta)})$,其中$n$为样本容量,$I(\theta)=\int{-\infty}^{\infty}(\frac{\part{lnp}}{\part\theta})^2p(x;\theta)dx$为费希尔信息量。
-
充分性(UMVUE)
- 任一参数$\theta$的UMVUE不一定存在,若存在,则它一定是充分统计量的函数;
- 若$\theta$的某个无偏估计$\hat{\theta}$不是充分统计量$T=T(x_1,…,x_n)$的函数,则通过条件期望可以获得一个新的无偏估计$\widetilde{\theta}=E(\hat{\theta|T})$,且方差比原估计的方差要小;
- 考虑$\theta$的估计时,只需要在其充分统计量的函数中寻找即可,该说法对所有统计推断都是正确的,这便是充分性原则。
5.2 区间估计 Interval Estimation
5.2.1 区间估计的概念
-
双侧区间
设$\theta$是总体的一个参数,其参数空间为$\Theta$,$x_1,…,x_n$是来自该总体的样本,对给定的一个$\alpha\quad(0<\alpha<1)$,假设有两个统计量$\hat{\theta}_L=\hat{\theta}_L(x_1,…,x_n)$和$\hat{\theta}_U=\hat{\theta}_U(x_1,…,x_n)$,若对任意的$\theta\in\Theta$,有
$$
P_\theta(\hat{\theta}_L\leq\theta\leq\hat{\theta}_U)\geq(=)1-\alpha
$$其中,总体为连续分布时取等号,表示用足了置信水平。称随机区间$[\hat{\theta}_L,\hat{\theta}_U]$为$\theta$的置信水平为$1-\alpha$的置信区间,或简称$[\hat{\theta}_L,\hat{\theta}_U]$是$\theta$的**$1-\alpha$置信区间**,$\hat{\theta}_L$和$\hat{\theta}_U$分别称为$\theta$的置信下限和置信上限。
Definition: Assume the population parameter $\theta$ is unknown. If there are two statistics $\hat{\theta}_1=\hat{\theta}_1\left(X_1, X_2, \ldots, X_n\right), \hat{\theta}_2=\hat{\theta}_2\left(X_1, X_2, \ldots, X_n\right)$ and $\hat{\theta}_1<$ $\hat{\theta}_2$ such that for any given $\alpha(0<\alpha<1)$,
$$
P\left{\hat{\theta}_1<\theta<\hat{\theta}_2\right}=1-\alpha
$$Then $\left(\hat{\theta}_1, \hat{\theta}_2\right)$ is called a $100 % \times(1-\alpha)$ or $1-\alpha$ confidence interval 置信区间 for $\theta$. Here $100 % \times(1-\alpha)$ or $1-\alpha$ is referred to as confidence level 置信水平.
- $\theta$ is some determinate number, $\hat{\theta}_1, \hat{\theta}_2$ are random variables, $\left(\hat{\theta}_1, \hat{\theta}_2\right)$ is random interval随机区间。
- $\left(\hat{\theta}_1, \hat{\theta}_2\right)$ contains $\theta$ with a probability of $1-\alpha$, or the probability of $\left(\hat{\theta}_1, \hat{\theta}_2\right)$ containing $\theta$ is $1-\alpha$.
- The confidence intervals vary with the observations of sample. Any one confidence interval from a particular sample may or may not contain the unknown parameter $\theta$.
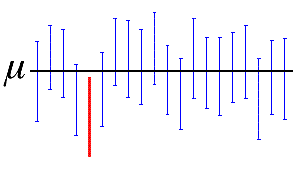
- Therefore, we can say over the collection of all 95% Cls that could be constructed from repeated random samples of size $n$, 95 of all these intervals will contain the parameter $\theta$. The remaining 5 % of all Cls will not contain the the parameter $\theta$.
置信水平$1-\alpha$的频率解释:在大量的区间估计观测值中,至少有$100(1-\alpha)%$包含$\theta$,如下图所示,其置信度为0.95.
-
单侧区间
设$\hat{\theta}_L=\hat{\theta}_L(x_1,…,x_n)$是统计量,对给定的$\alpha\in(0,1)$和任意的$\theta\in\Theta$,有
$$
P_\theta(\hat{\theta}_L\leq\theta)\geq1-\alpha,\quad\forall\theta\in\Theta
$$则称$\hat{\theta}_L$为$\theta$的置信水平为$1-\alpha$的置信下限。同理,设$\hat{\theta}_U=\hat{\theta}_U(x_1,…,x_n)$是统计量,对给定的$\alpha\in(0,1)$和任意的$\theta\in\Theta$,有
$$
P_\theta(\hat{\theta}_L\geq\theta)\geq1-\alpha,\quad\forall\theta\in\Theta
$$则称$\hat{\theta}_L$为$\theta$的置信水平为$1-\alpha$的置信上限。
5.2.2 区间估计的方法
-
枢轴量法
Step 1:设法构造一个样本和$\theta$的函数$G=G(x_1,…,x_n,\theta)$使得**$G$的分布不依赖于未知参数**,称具有这种性质的$G$为枢轴量。
Step 2:适当地选择两个常数c,d,使对给定的$\alpha\quad(0<\alpha<1)$,有
$$
P(c\leq G\leq d)=1-\alpha
$$(在离散场合,将上式等号改为$\geq$)
Step 3:假如能将$c\leq G\leq d$进行不等式等价变形化为$\hat{\theta}_L\leq\theta\leq\hat{\theta}_U$,则有
$$
P_\theta(\hat{\theta}_L\leq\theta\leq\hat{\theta}_U)=1-\alpha
$$表明$[\hat{\theta}_L,\hat{\theta}_U]$是$\theta$的$1-\alpha$同等置信区间。
**注:**满足条件的c和d有很多,最终选择的目的是希望平均长度$E_\theta(\hat{\theta}_U)-\hat{\theta}_L$尽可能短,但在一些场合中很难做到这一点,因此可以选择c和d,使得两个尾部概率各为$\alpha/2$,即
$$
P_\theta(G<c)=P_\theta(G>d)=\alpha/2
$$得到等尾置信区间。
例:设$x_1,…,x_n$是来自均匀总体$U(0,\theta)$的一个样本,试对设定的$\alpha\ (0<\alpha<1)$给出$\theta$的$1-\alpha$同等置信区间。
解:三步法:
- 已知$\theta$的最大似然估计为样本的最大次序统计量$x_{(n)}$,而$x_{(n)}/\theta$的密度函数为
$$
p(y;\theta)=ny^{n-1},\quad 0<y<1
$$
它与参数$\theta$无关,故可取$x_{(n)}/\theta$作为枢轴量$G$。 - 由于$x_{(n)}/\theta$的分布函数为$F(y)=y^n$,$0<y<1$,故$P(c\leq x_{(n)}/\theta\leq d=d^n-c^n)$,因此可以选择适当的c和d满足
$$
d^n-c^n=1-\alpha
$$ - 在$0\leq c<d\leq 1$及$d^n-c^n=1-\alpha$的条件下,当$d=1, c=\sqrt[n]{\alpha}$时,$E_\theta(\hat{\theta}U)-\hat{\theta}L$取最小值,所以$[x{(n)},x{(n)}/\sqrt[n]{\alpha}]$是$1-\alpha$置信区间
- 已知$\theta$的最大似然估计为样本的最大次序统计量$x_{(n)}$,而$x_{(n)}/\theta$的密度函数为
5.2.3 一些情况下的区间估计
-
单个正态总体参数的置信区间
- $\sigma$已知时$\mu$的置信区间:$[\bar{x}-u_{\alpha/2}\sigma/\sqrt{n},\quad\bar{x}+u_{\alpha/2}\sigma/\sqrt{n}]$
- $\sigma$未知时$\mu$的置信区间:$[\bar{x}-t_{\alpha/2}(n-1)s/\sqrt{n},\quad\bar{x}+t_{\alpha/2}(n-1)s/\sqrt{n}]$
- $\sigma^2$的置信区间($\mu,\sigma$未知):$[(n-1)s^2/\chi^2_{\alpha/2}(n-1),\quad(n-1)s^2/\chi^2_{1-\alpha/2}(n-1)]$
-
大样本置信区间:$[\bar{x}-u_{1-\alpha/2}\sqrt{\frac{\bar{x}(1-\bar{x})}{n}},\quad \bar{x}+u_{1-\alpha/2}\sqrt{\frac{\bar{x}(1-\bar{x})}{n}}]$
-
两个正态总体下的置信区间
-
$\mu_1-\mu_2$的置信区间
- $\sigma^2_1$和$\sigma^2_2$已知时:$[\bar{x}-\bar{y}-u_{1-\alpha/2}\sqrt{\frac{\sigma^2_1}{m}+\frac{\sigma^2_2}{n}},\quad \bar{x}-\bar{y}+u_{1-\alpha/2}\sqrt{\frac{\sigma^2_1}{m}+\frac{\sigma^2_2}{n}}]$
- $\sigma^2_1=\sigma^2_2=\sigma^2$未知时:
$$
[\bar{x}-\bar{y}-\sqrt{\frac{m+n}{mn}}s_wt_{1-\alpha/2}(m+n-2),\quad \bar{x}-\bar{y}+\sqrt{\frac{m+n}{mn}}s_wt_{1-\alpha/2}(m+n-2)]
$$ - $\sigma^2_2/\sigma^2_1=c$已知时:$[\bar{x}-\bar{y}-\sqrt{\frac{mc+n}{mn}}s_wt_{1-\alpha/2}(m+n-2),\quad \bar{x}-\bar{y}+\sqrt{\frac{mc+n}{mn}}s_wt_{1-\alpha/2}(m+n-2)]$
- 当m和n都很大时的近似置信区间:$[\bar{x}-\bar{y}-u_{1-\alpha/2}\sqrt{\frac{s^2_x}{m}+\frac{s^2_y}{n}},\quad \bar{x}-\bar{y}+u_{1-\alpha/2}\sqrt{\frac{s^2_x}{m}+\frac{s^2_y}{n}}]$
- 一般情况下的近似置信区间:$[\bar{x}-\bar{y}-s_0t_{1-\alpha/2}(l),\quad \bar{x}-\bar{y}+s_0t_{1-\alpha/2}(l)]$
-
$\sigma^2_1/\sigma^2_2$的置信区间:
$$
[\frac{s_x^2}{s_y^2}\cdot\frac{1}{F_{1-\alpha/2(m-1,n-1)}},\quad \frac{s_x^2}{s_y^2}\cdot\frac{1}{F_{\alpha/2(m-1,n-1)}}]
$$
-
Chapter 6 假设检验 Hypothesis Testing
6.1 假设检验的基本思想和概念
-
基本思想
以“女士品茶”为例,对于该女士有没有品茶的能力,有两种假设:该女士没有品茶能力和该女士有品茶能力。在统计上这两个非空不相交参数集合称作统计假设,简称假设。通过样本对一个假设作出对与不对的判断,则称为该假设的一个检验。若检验结果否定该命题,则称拒绝这个假设,否则就**接受(不拒绝)**这个假设。
Test whether $H_0: \quad \mu=\mu_0$ is correct or not by contradiction 反证法:
- first assume that the null hypothesis $H_0:\mu=\mu_0$ is true.
- under $H_0$, we infer according to the sampling distribution theory and sample information.
- reject $H_0$ if we get contradictory conclusions based on small probability principle; otherwise, accept $H_0$.
Small probability principle 小概率原理: the event with probability no more than 0.05 is almost impossible to occur in just one trial.
假设可分为两种:1. 参数假设检验 parametric test,即已经知道数据的分布,针对总体的某个参数进行假设检验 population distribution is known but population parameter is unknown;2. 非参数假设检验 nonparametric test,即数据分布未知,针对该分布进行假设检验 population distribution is unknown。
-
假设检验的基本步骤
建立假设—>选择检验统计量,给出拒绝域形式—>选择显著性水平—>给出拒绝域—>做出判断
Step 1:建立假设
主要针对参数假设检验问题
设有来自某分布族${F(x,\theta)|\theta\in\Theta}$的样本$x_1,…,x_n$,其中$\Theta$为参数空间,设$\Theta_0\in\Theta$,且$\Theta_0\neq\phi$,则命题$H_0:\theta\in\Theta_0$称为原假设或零假设(null hypothesis),若有另一个$\Theta_1$($\Theta_1\in\Theta,\Theta_1\Theta_0=\phi$,常见的一种情况是$\Theta_1=\Theta-\Theta_0$),则命题$H_1:\theta\in\Theta_1$称为$H_0$的对立假设或备择假设(alternative hypothesis),当$H_0$为简单假设,即$\Theta_0$只含一个点时,备择假设有三种可能:$H_1’:\theta\neq\theta_0$,$H_1’‘:\theta<\theta_0$,$H_1’‘’:\theta>\theta_0$。
The null hypothesis 零假设,denoted by $H_0$, is the hypothesis that is to be tested. The null hypothesis is a statement of no change, no effect or no difference and is assumed true until evidence indicates otherwise.
The alternative hypothesis 备择假设,denoted by $H_1$, is the hypothesis that in some sense contradicts the null hypothesis and is a statement that we are trying to find evidence to support.
In general, the null hypothesis is represented by the value of the unknown population parameter is equal to some specific value, i.e.,
$$
H_0 \text { : parameter }=\text { some value } \quad\left(H_0: \quad \mu=\mu_0\right)
$$The alternative hypothesis is allowed to be either greater than or less than some specific value.
$H_1$ : parameter $\neq$ some value two-tailed test 双侧检验
$H_1$ : parameter $>$ some value right(upper)-tailed test 单侧检验
$H_1$ : parameter $<$ some value left(lower)-tailed test 单侧检验Step 2:选择检验统计量,给出拒绝域形式
根据样本计算统计量$Z$(如样本均值、标准差等,称为检验统计量),并基于某个法则既可以决定接受$H_0$还是拒绝$H_0$,具体地,当统计量在拒绝域$W$ (rejection region) 中即拒绝$H_0$,在接受域$\overline{W}$ (acceptance region) 中即接受$H_0$。由此可见,一个拒绝域$W$唯一确定一个检验法则,反之,一个检验法则也唯一确定一个拒绝域。
**注:**不能用一个样本(例子)证明一个命题(假设成立),但是可以用一个样本(例子)去推翻一个命题。此外,拒绝域与接受域之间有一个模糊域,即统计量恰好符合法则,通常将模糊域归为接受域,因此接受域是复杂的。
Step 3:选择显著性水平
假设检验基于小概率事件,即小概率事件在一次试验中几乎不会发生,因此选择一个很小的概率值$\alpha$,令$p(拒绝H_0|H_0为真)\leq\alpha$,表示$Z\in W$是一个小概率事件,在一次试验中不应该发生。如果通过样本得到的统计量$z\in W$,即不该发生的小概率事件竟然发生了,那么应该拒绝$H_0$。
由于向本是随机的,通常做检验时可能做出错误判断,由此引入了两个错误,分别为第一类错误和第二类错误,如下表所示。
观测数据情况 总体情况 总体情况 $H_0$为真 $H_1$为真 拒绝$H_0$ 第一类错误(拒真) 正确 接受$H_0$ 正确 犯第二类错误(取伪) 犯第一类错误概率:$\alpha=P(X\in W|H_0)$,即$\alpha=P(拒绝H_0|H_0为真)$;
犯第二类错误概率:$\beta=P(X\in \overline{W}|H_1)$,即$\beta=P(接受H_0|H_0为假)$。
Definition: The probability of a type I error 第一类错误,which is usually denoted by $\alpha$, is the probability of rejecting $H_0$ when $H_0$ is true, (“reject the true” 拒真)
$$
\alpha=P{\text { type I error }}=P\left{\text { reject } H_0 \text { when } H_0 \text { true }\right}
$$Definition: The probability of a type II error 第二类错误, which is usually denoted by $\beta$, is the probability of accepting $H_0$ when $H_1$ is true, (“accept the false” 取伪)
$$
\beta=P{\text { type II error }}=P\left{\text { accept } H_0 \text { when } H_1 \text { true }\right}
$$可以证明的,在一定样本量下,两类错误概率无法共同减小,但是当样本增加时,可以同时减小。A common practice is to limit $\alpha$ first and then to determine sample size to make $\beta$ as small as possible. 通常限制犯第一类错误的概率,然后适当确定样本容量使犯第二类错误的概率尽可能小。
证明该问题需要引入是函数,下面将简单介绍势函数,但不对上述结论证明。
定义:设检验问题$H_0:\theta\in\Theta_0\quad vs\quad H_1:\theta \in \Theta_1$的拒绝域为$W$,则样本观测值$\mathbf{X}$落在拒绝域$W$内的概率称为该检验的势函数,记为
$$
g(\theta)=P_\theta(\mathbf{X}\in W),\ \theta\in\Theta=\Theta_0\cup\Theta_1\
g(\theta)=\left{\begin{matrix}
\alpha(\theta) & \theta\in\Theta_0\
1-\beta(\theta) &\theta\in\Theta_1
\end{matrix}\right.
$$第一类错误概率$\alpha$即为初始设定的很小的概率,称为置信水平 significance level,称该检验时显著性水平为$\alpha$的显著性检验,简称水平为$\alpha$的检验。为了尽量减少两类错误,可简单的将其简化为减小第一类错误概率(第二类错误概率难求)。常用的$\alpha=0.05$有时也选择0.1或0.01。
Step 4:给出拒绝域
为了使得第一类错误的概率尽可能小,给定一个较小的$\alpha$,并选择一个数$k$,设定若$Z\geq k$拒绝$H_0$,使得$P(u=|\frac{z-\mu}{\sigma/\sqrt{n}}|\geq k)\leq \alpha$,所以$k=u_{\alpha/2}$。
注:算拒绝域时,需基于标准正态分布。
Step 5:做出判断
通过样本计算统计量,若统计量在拒绝域中,则拒绝原假设,否则接受原假设。
-
检验的$p$值
不同置信水平$\alpha$的取值,可能会存在不同的结果。因此引入新的指标,即利用样本观测值能够作出拒绝原假设的最小显著水平,称为检验的$p$值。由检验的$p$值与心目中的显著性水平$\alpha$进行比较,可以容易做出检验结论:
- 若$\alpha\geq p$,则在显著性水平$\alpha$下拒绝$H_0$;
- 若$\alpha<p$,则在显著性水平$\alpha$下接受$H_0$.
**注:**一般以$p<0.05$ 为有统计学差异, $p<0.01$ 为有显著统计学差异,$p<0.001$为有极其显著的统计学差异。
6.2 One-Sample Hypothesis Testing 单样本假设检验
Tests of hypotheses based on one sample from $N\left(\mu, \sigma^2\right)$
- One-sample $u$ test for the mean of $N\left(\mu, \sigma^2\right)$ with $\sigma^2$ known
- One-sample $t$ test for the mean of $N\left(\mu, \sigma^2\right)$ with $\sigma^2$ unknown
- One-sample $\chi^2$ test for the variance of $N\left(\mu, \sigma^2\right)$
Tests of hypotheses based on two samples
- Two-sample paired $t$ test
- Two-sample $t$ test
- Two-sample F test
One-sample u test for the mean of a normal distribution with known variance: two-tailed case
Summarize the steps in below:
- Establish hypothesis $H_0:\mu=\mu_0$ vs. $H_1: \mu \neq \mu_0$
- Calculate the value of test statistic $u=\frac{x-\mu_0}{\frac{\sigma}{\sqrt{n}}}$ according to observations
- Find $u_{\frac{\alpha}{2}}$ for a given significance level of $\alpha$
- Make statistical inference:
- If $|u|>u_{\frac{\alpha}{2}}$, then $H_0$ is rejected at a significance level of $\alpha$, and it is considered that there is a significant difference between $\mu$ and $\mu_0$.
- If $|u| \leq u_{\frac{\alpha}{2}}$, then $H_0$ is accepted at a significance level of $\alpha$, and it is considered that there is no significant difference between $\mu$ and $\mu_0$.
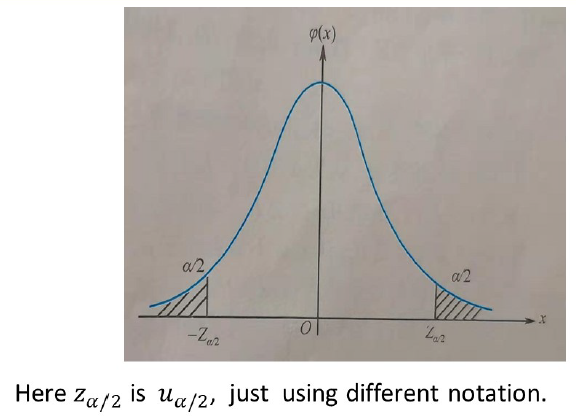
One-sample u test for the mean of a normal distribution with known variance: one-tailed case
Summarize the steps below:
- Establish hypothesis
$$
H_0: \mu=\mu_0 \text { vs. } H_1: \mu>\mu_0\left(\text { or } H_1: \mu<\mu_0\right)
$$
- Calculate the value of test statistic according to observations
$$
u=\frac{\bar{x}-\mu_0}{\sigma/\sqrt{n}}
$$
-
Find $u_\alpha$ for a given significance level of $\alpha$
-
Make statistical inference:
If $u>u_\alpha$, then $H_0$ is rejected at a significance level of $\alpha$.
If $u \leq u_\alpha$, then $H_0$ is accepted at a significance level of $\alpha$;
or
(If $u<-u_\alpha$, then $H_0$ is rejected at a significance level of $\alpha$.
If $u \geq-u_\alpha$, then $H_0$ is accepted at a significance level of $\alpha$.)
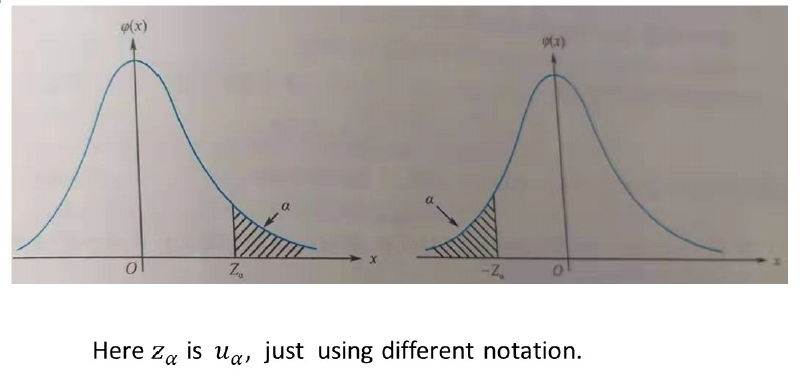
One-sample t test for the mean of a normal distribution with unknown variance
We want to test
$$
H_0:\mu=\mu_0 \text { vs. } H_1: \mu \neq \mu_0
$$
If the variance $\sigma^2$ is unknown, we just replace $\sigma^2$ by sample variance $S^2$. Under $H_0: \quad \mu=\mu_0$, we have
$$
t=\frac{\bar{x}-\mu_0}{S / \sqrt{n}} \sim t(n-1)
$$
Then the steps for two-tailed $t$ test, which is similar to one-sample $u$ test, is given below:
- Establish hypothesis $H_0: \mu=\mu_0$ vs. $\quad H_1: \mu \neq \mu_0$
- Calculate the value of test statistic according to observations
$$
t=\frac{\bar{x}-\mu_0}{S / \sqrt{n}}
$$
-
Find $t_{\frac{\alpha}{2}}(n-1)$ for a given significance level of $\alpha$
-
Make statistical inference:
If $|t|>t_{\frac{\alpha}{2}}(n-1)$, then $H_0$ is rejected at a significance level of $\alpha$.
If $|t| \leq t_{\frac{\alpha}{2}}(n-1)$, then $H_0$ is accepted at a significance level of $\alpha$.Remark: The above test procedure is called a $\boldsymbol{t}$ test because the test statistic
$$
t=\frac{\bar{x}-\mu_0}{S / \sqrt{n}} \sim t(n-1)
$$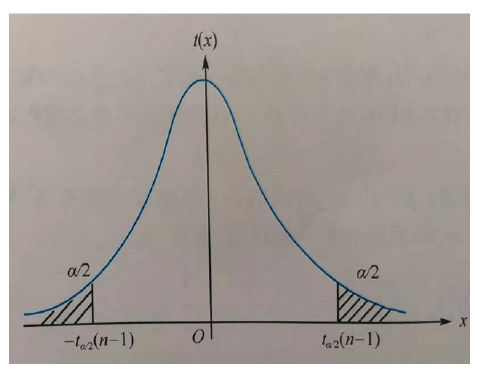
-
The steps for one-sample t test in one-tailed case
- Establish hypothesis
$$
H_0: \mu=\mu_0 \text { vs. } H_1: \mu>\mu_0\left(\text { or } H_1: \mu<\mu_0\right)
$$- Calculate the value of test statistic according to observations
$$
t=\frac{\bar{x}-\mu_0}{S / \sqrt{n}}
$$-
Find $t_\alpha$ for a given significance level of $\alpha$.
-
Make statistical inference:
- If $t>t_\alpha(n-1)$, then $H_0$ is rejected at a significance level of $\alpha$.
If $t \leq t_\alpha(n-1)$, then $H_0$ is accepted at a significance level of $\alpha$;
or
If $t<-t_\alpha(n-1)$, then $H_0$ is rejected at a significance level of $\alpha$.
If $t \geq-t_\alpha(n-1)$, then $H_0$ is accepted at a significance level of $\alpha$.)
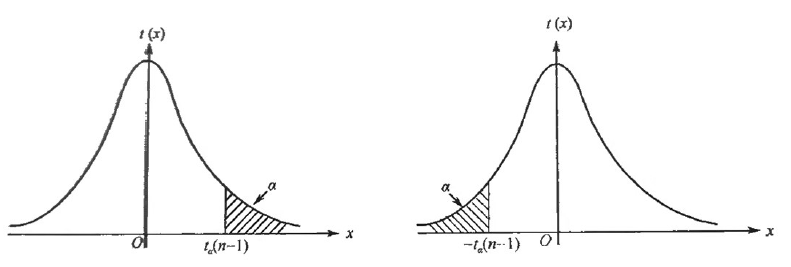
- If $t>t_\alpha(n-1)$, then $H_0$ is rejected at a significance level of $\alpha$.
One-sample $\chi^2$ test for the variance of a normal distribution
If $X_1, X_2, \ldots, X_n$ are random sample from an $N\left(\mu, \sigma^2\right)$ distribution with unknown $\mu$ and $\sigma^2$.
We want to test the hypothesis
$$
H_0: \sigma^2=\sigma_0^2 \quad \text { vs. } \quad H_1: \sigma^2 \neq \sigma_0^2
$$
Here $\sigma_0^2$ is known.
Under $H_0: \sigma^2=\sigma_0^2$, consider $S^2$ is unbiased estimator of $\sigma^2$, we known that
$$
\chi^2=\frac{(n-1) S^2}{\sigma_0^2} \sim \chi^2(n-1)
$$
Two-tailed test $H_0: \sigma^2=\sigma_0^2 ; \quad H_1: \sigma^2 \neq \sigma_0^2$
Steps:
- Establish hypothesis $H_0: \sigma^2=\sigma_0^2$ vs. $H_1: \sigma^2 \neq \sigma_0^2$
- Calculate the value of test statistic according to observations
$$
\chi^2=\frac{(n-1) S^2}{\sigma_0^2}
$$
-
Find $\chi_{\alpha / 2}^2(n-1)$ and $\chi_{1-\frac{\alpha}{2}}^2(n-1)$ for a given significance level of $\alpha$.
-
Make statistical inference
If $\chi^2>\chi_{\frac{\alpha}{2}}^2(n-1)$ or $\chi^2<\chi_{1-\frac{\alpha}{2}}^2(n-1)$, then $H_0$ is rejected at a significance level of $\alpha$.
If $\chi_{1-\frac{\alpha}{2}}^2(n-1)<\chi^2<\chi_{\alpha / 2}^2(n-1)$, then $H_0$ is accepted at a significance level of $\alpha$.
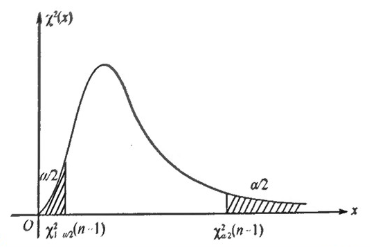
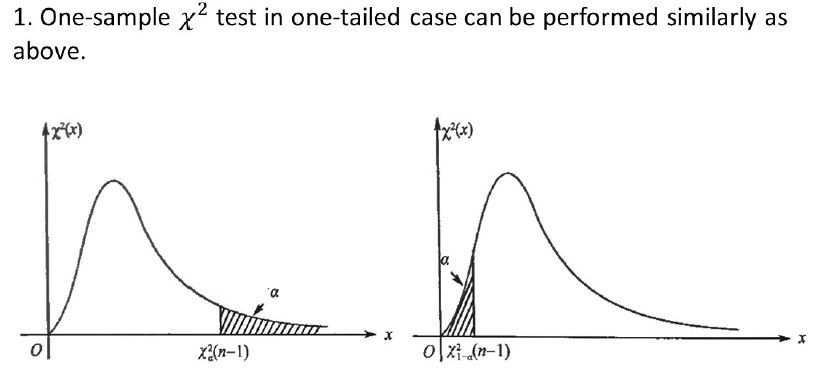
6.3 Two-Samples Hypothesis Testing 双样本假设检验
-
Introduction:
All the tests introduced before were one-sample tests:
Test for mean: one-sample $u$ test, one-sample $t$ test
Test for variance: one-sample $\chi^2$ test.
Actually, a more frequently encountered situation is the two-sample hypothesis testing problem.These two samples can be paired 配对的 or can be completely independent.
-
Definition: Two samples are said to be paired when each data point in the first sample is matched and is related to a unique data point in the second sample.
Definition: Two samples are said to be independent when each data points in one sample are unrelated to the data points in the second sample.
-
Remark
- The two paired samples are not independent.
- The paired samples may represent two sets of measurements.
- On the same subject: in this case, each subject is used as its own control
- On different subjects: that are similar to each other in matching criteria, such as age, twins and so on.
-
Paired t test for mean
-
Because the paired samples are not independent, we consider the difference $\boldsymbol{d}_{\boldsymbol{i}}(\boldsymbol{i}=\mathbf{1}, \mathbf{2}, \ldots, \boldsymbol{n})$ between these two sample points and then $d_i(i=1,2, \ldots, n)$ can be regarded as a random sample from a new population.
-
The new population (i.e., all the possible differences) can be understood as a result caused by many minute independent random factors, and be regarded to follow a normal distribution $N\left(\mu_d, \sigma_d^2\right)$, here $\mu_d, \sigma_d^2$ are the population mean and population variance respectively.
-
To test whether there is a significant difference between th-5321`2is two samples implies to test the whether population mean
$$
\mu_d=0
$$Hence,
$$
H_0: \mu_d=0 \quad \text { vs. } \quad H_1: \mu_d \neq 0
$$The hypothesis testing problem is reduced to one-sample $t$ test for mean with unknown variance $\sigma_d^2$ based on differences $d_i(i=1,2, \ldots, n)$.
The test statistic is
$$
t=\frac{\bar{d}-\mu_d}{S_d / \sqrt{n}}=\frac{\bar{d}}{S_d / \sqrt{n}}
$$Where:
$\bar{d}$ is the sample mean of differences $d_i(i=1,2, \ldots, n)$
$S_d$ is the sample standard deviation of differences $d_i(i=1,2, \ldots, n)$ $n$ is the number of matched pairs.
-
-
Two-sample t test for independent samples
Now we test the equality of two means of two independent samples. Suppose $X_1, X_2, \ldots, X_{n_1} \sim N\left(\mu_1, \sigma_1^2\right), Y_1, Y_2, \ldots, Y_{n_2} \sim N\left(\mu_2, \sigma_2^2\right)$ and these two random samples are independent. The means and variances in these two samples are denoted by $\bar{x}, \bar{y}, S_1^2, S_2^2$ respectively.
We want to test the hypothesis
$$
H_0: \quad \mu_1=\mu_2 \quad \text { vs. } \quad H_1: \mu_1 \neq \mu_2
$$We will base the significance test on the difference between the two sample means, $\bar{x}-\bar{y}$.
Assume variances $\sigma_1^2, \sigma_2^2$ are known.
Frist from the sampling distribution of $\bar{x}-\bar{y}$, we have
$$
u=\frac{\bar{x}-\bar{y}-\left(\mu_1-\mu_2\right)}{\sqrt{\frac{\sigma_1^2}{n_1}+\frac{\sigma_2^2}{n_2}}} \sim N(0,1)
$$Under $H_0: \quad \mu_1=\mu_2$,
$$
u=\frac{\bar{x}-\bar{y}}{\sqrt{\frac{\sigma_1^2}{n_1}+\frac{\sigma_2^2}{n_2}}} \sim N(0,1)
$$Then the test
$$
H_0: \quad \mu_1=\mu_2 \quad \text { vs. } \quad H_1: \mu_1 \neq \mu_2
$$can be performed similarly to one-sample $\boldsymbol{u}$ test using test statistic
$$
u=\frac{\bar{x}-\bar{y}}{\sqrt{\frac{\sigma_1^2}{n_1}+\frac{\sigma_2^2}{n_2}}}
$$Assume variances $\sigma_1^L, \sigma_2^L$ are unknown and the variances are the same, i.e., $\sigma_1^2=\sigma_2^2=\sigma^2$.
Similarly, to test $H_0: \mu_1=\mu_2$, we first consider the sampling distribution $\bar{X}-\bar{Y}$. From chapter 4 , we know
$$
\frac{(\bar{X}-\bar{Y})-\left(\mu_1-\mu_2\right)}{S \sqrt{\frac{1}{n_1}+\frac{1}{n_2}}} \sim t\left(n_1+n_2-2\right)
$$where
$$
\left.S^2=\frac{\left(n_1-1\right) S_1^2+\left(n_2-1\right) S_2^2}{n_1+n_2-2} \quad \text { (if } n_1=n_2, \quad S^2=\frac{S_1^2+S_2^2}{2}\right)
$$Then the test
$$
H_0: \quad \mu_1=\mu_2 \quad \text { vs. } \quad H_1: \mu_1 \neq \mu_2
$$with equal variances can be performed similarly to one-sample $t$ test using test statistic
$$
t=\frac{\bar{x}-\bar{y}}{S \sqrt{\frac{1}{n_1}+\frac{1}{n_2}}}
$$with
$$
S^2=\frac{\left(n_1-1\right) S_1^2+\left(n_2-1\right) S_2^2}{n_1+n_2-2} .
$$ -
Testing for the equality of two variances
In the following sections, we shall test
The equality of two variances 方差齐性检验
We want to test
$$
H_0: \sigma_1^2=\sigma_2^2 \quad \text { vs. } \quad H_1: \sigma_1^2 \neq \sigma_2^2
$$Similar to the idea of one-sample $\chi^2$ test for variance, this test is also based on the ratio of sample variance $\frac{S_1^2}{S_2^2}$ rather than the difference $S_1^2-$ $S_2^2$
From the sampling distribution of $\frac{S_1^2}{S_2^2}$ in chapter 4 , we have
$$
F=\frac{S_1^2 / \sigma_1^2}{S_2^2 / \sigma_2^2} \sim F\left(n_1-1, n_2-1\right)
$$Under $H_0: \sigma_1^2=\sigma_2^2$, it follows that
$$
F=\frac{S_1^2}{S_2^2} \sim F\left(n_1-1, n_2-1\right)
$$Now steps for the equality of two variances is given below.
-
Steps for F test
-
Establish hypothesis
$$
H_0: \sigma_1^2=\sigma_2^2 \quad \text { vs. } \quad H_1: \sigma_1^2 \neq \sigma_2^2
$$ -
Calculate the value of test statistic according to observations
$$
F=\frac{S_1^2}{S_2^2}
$$(To simplify the calculation, we normally choose the larger variance as numerator, such that $F=\frac{s_1^2}{s_2^2}>1$).
-
Find $F_{\frac{\alpha}{2}}\left(n_1-1, n_2-1\right)$ for a given significance level $\alpha$.
Also, according to the property $F$ distribution, we have
$$
F_{1-\frac{\alpha}{2}}\left(n_1-1, n_2-1\right)=\frac{1}{F_{\frac{\alpha}{2}}\left(n_2-1, n_1-1\right)}<1<F_{\frac{\alpha}{2}}\left(n_1-1, n_2-1\right) .
$$Then it suffices to find the critical value $F_{\frac{\alpha}{2}}\left(n_1-1, n_2-1\right)$.
-

